Free Narrow CPR Stock Scanner: Daily Shortlist for Breakout Trades
Narrow CPR · Stock Scanner
There are no items in your cart
Add More
Add More
| Item Details | Price | ||
|---|---|---|---|
Formula, calculation, Narrow & Wide CPR, VWAP/EMA combinations, NIFTY & BANK NIFTY application, options, scanners, entry-SL-target rules and real chart examples — the full Trading Direction framework in one place.

CPR (Central Pivot Range) is a three-line price structure — Pivot, TC and BC — calculated from the previous session's high, low and close. It tells you the day's trend bias before the first candle even forms: price holding above CPR favours longs, price holding below favours shorts, and price stuck inside CPR usually means a slow, range-bound session. A Narrow CPR signals a likely trending breakout day, while a Wide CPR signals a choppy one. Traders use it to set bias, mark support/resistance, and time entries on NIFTY, BANK NIFTY, stocks and options.
Central Pivot Range (CPR) is a price-action indicator built from three levels — Pivot, Top Central (TC) and Bottom Central (BC) — derived from the prior day's high, low and close, used to gauge intraday trend bias and dynamic support/resistance.
Most traders open their charts, see fifteen indicators fighting for attention, and still can't answer one basic question: is today a trend day or a range day? CPR answers that before the market even opens. This page is the full Trading Direction framework on Central Pivot Range — how it's built, how we read it, how we combine it with VWAP and EMA, how we apply it to NIFTY, BANK NIFTY, stocks and options, and exactly where entries, stop-losses and targets go. Bookmark it — every other CPR article on this site links back here.
"The market doesn't punish you for being wrong. It punishes you for trading without structure." — Anil Hanegave
Anil Hanegave started out working a job in the agriculture sector before stepping into the markets in 2018. Like most beginners, he leaned on borrowed strategies — indicators piled on indicators, YouTube shortcuts, and a portfolio that reacted to news instead of structure. The losses weren't just financial; they were a wake-up call.
Anil Hanegave, before the shift into full-time trading
The turning point came when Anil stopped asking "which indicator will make me rich" and started asking "how does the market actually organise itself, day after day?" That question led him to pivot-based price action and, eventually, to CPR — a framework that doesn't try to predict the market, but simply helps traders read where it's balanced, where it's likely to trend, and where it's likely to consolidate.

Anil Hanegave at the Trading Direction office
In 2020, that struggle-to-clarity journey became Trading Direction. Anil has since trained 21,000+ students across India, authored multiple published trading books, and built a YouTube community that watches him break down CPR, price action and Smart Money Concepts in plain Hindi and English — the way he wishes someone had explained it to him when he was starting out.
CPR is a price-action structure calculated from the previous session's high, low and close. Price is the king of the market — CPR is simply the queen that helps you read its mood. Unlike lagging indicators that react after a move has already happened, CPR gives you a forward-looking reference zone for the next session, showing where the market is likely to find balance and where it may break into a trend.
At Trading Direction, CPR sits at the core of every strategy we teach: intraday trend bias, breakout confirmation, options buying and selling zones, and multi-timeframe alignment for swing setups on NIFTY, BANK NIFTY and individual stocks. We build it into the CPR Brahmastra framework and into the CPR By Trading Direction indicator series that plots these levels automatically.
CPR has three components, all derived from the prior day's High (H), Low (L) and Close (C):
| Component | Formula | Role |
|---|---|---|
| Pivot (P) | (High + Low + Close) / 3 | Central reference point |
| BC (Bottom Central) | (High + Low) / 2 | Lower boundary of the range |
| TC (Top Central) | (Pivot − BC) + Pivot | Upper boundary of the range |
If TC comes out lower than BC on your calculation, simply swap them — TC is always the higher value, BC the lower one. Most trading platforms and our CPR By Trading Direction indicator plot this automatically, but knowing the formula matters because it tells you why CPR width behaves the way it does: the closer High and Low are to each other, the narrower the range between TC and BC.
Manual calculation, one session
In live practice nobody calculates this by hand every morning — you'd waste your first ten minutes on arithmetic instead of watching price. This is exactly why we built the CPR By Trading Direction indicator: it auto-plots CPR, marks Narrow/Wide status, and shows prior-day CPR relationships so you can spend that time reading the chart instead of your calculator.
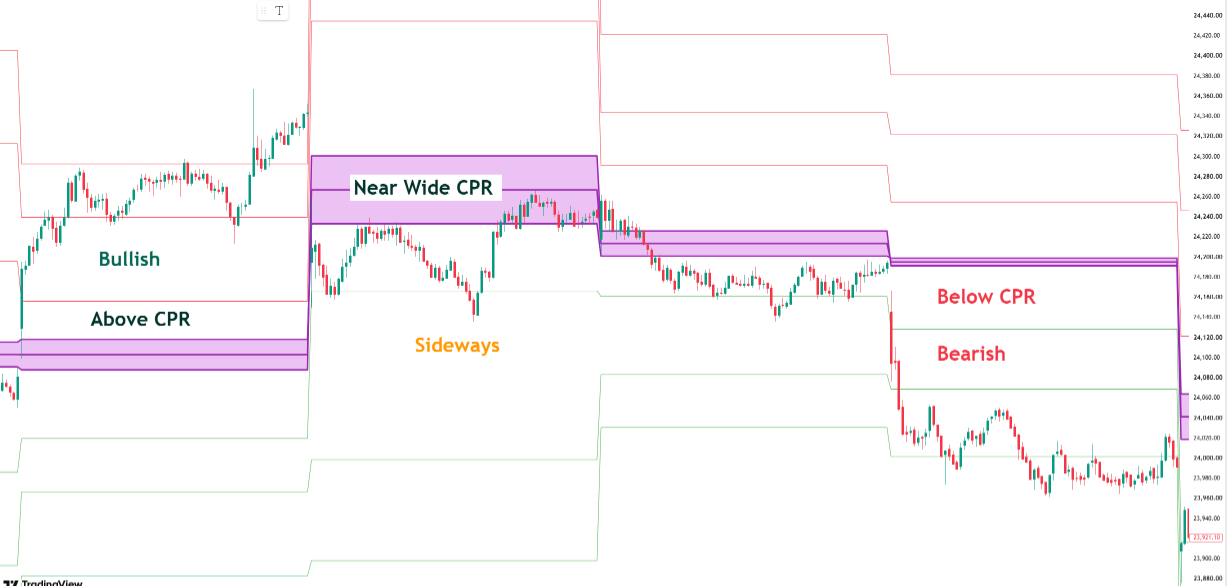
CPR levels — TC, Pivot and BC — plotted for trend analysis
Here's where it gets interesting: bias isn't a trade signal by itself. It's a filter. If price is above CPR, you only look for long setups and you stop hunting for short trades no matter how tempting they look. That single discipline removes half the impulsive trades a new trader takes in a session.
A Narrow CPR forms when TC and BC sit close together, signalling compression in the prior session. Compression tends to resolve into expansion — which is why a Narrow CPR day is statistically more likely to produce a strong, trending, breakout session than a normal or wide one. Two or three consecutive Narrow CPR days stack that probability further and are treated as a high-alert signal in our CPR Brahmastra framework.
The trap: a Narrow CPR tells you a breakout is likely, not which direction it will go. Traders who jump in before the first 15–30 minutes confirm direction are trading a guess, not a setup.
A Wide CPR forms when TC and BC are far apart — usually after a session with a large high-to-low swing. This signals a choppy, range-bound day with lower breakout probability. On Wide CPR days, we shift the plan from breakout-chasing to range-trading: fading the edges of the range rather than expecting a clean directional move.
| Narrow CPR | Wide CPR | |
|---|---|---|
| TC–BC gap | Small / compressed | Large / stretched |
| Likely session type | Trending, breakout-prone | Range-bound, choppy |
| Default plan | Wait for breakout + retest, then trade direction | Fade range edges, avoid chasing breakouts |
| Risk if misread | Entering before direction confirms | Holding a breakout trade that fails and reverts |
A Virgin CPR is a CPR level that price hasn't touched in recent sessions. Because it's untested, it tends to act as a high-probability support or resistance zone the first time price actually reaches it — unlike a level that's already been tested and chewed through multiple times. We flag Virgin CPR levels specifically because the first touch on an untested zone usually produces a sharper reaction than the third or fourth touch on a well-worn one.
Now look at what happens after a CPR breakout. The first candle gives the breakout, but that alone isn't enough. What matters is whether price sustains above (or below) the level. If it immediately comes back inside the CPR, the breakout is no longer as clean — that's a fakeout, not a breakout, and it's the single most common reason beginner CPR trades fail.
CPR breakout confirmation checklist
A breakout is not automatically a trade. The setup looks good on paper — the problem starts after entry, when the retest fails and traders hold on hoping it comes back.
VWAP (Volume Weighted Average Price) tells you where the "fair value" of the session sits based on actual traded volume — CPR tells you the structural bias. Combined, they're more powerful than either alone: a breakout above CPR that's also holding above VWAP has both a structural and a volume-based reason to continue. A breakout above CPR while price is still below VWAP is a weaker signal — the move lacks participation behind it.
Yahan problem strategy ki nahi, execution ki hai — the strategy is often fine; it's entering without this second confirmation that causes early stop-outs.
Adding a fast EMA (commonly the 20 or 50 period) on top of CPR gives you a moving, dynamic confirmation layer next to CPR's fixed daily levels. When price is above CPR and above a rising EMA, the bullish bias has two independent forms of confirmation instead of one. When CPR and EMA disagree — say, price above CPR but below a falling EMA — that's a signal to reduce size or wait rather than force the trade.
CPR tells you where to watch. Price action tells you what to do when price gets there. A rejection wick at TC on a bearish day, a strong-bodied candle closing beyond BC, a doji sitting exactly on Pivot — these candle behaviours at CPR levels are what actually trigger entries in our framework, not the CPR line by itself. This is also where Support & Resistance, trendlines and prior swing highs/lows get layered on top of CPR for confluence.
On NIFTY, CPR is used primarily to set the session's directional bias within the first candle or two, then to time entries on pullbacks to CPR (in a trending session) or fades at the range edges (in a Wide CPR session). Because NIFTY is an index rather than a single stock, its CPR reactions tend to be cleaner and less noisy than individual stock CPR — which is why most traders start applying CPR here first before moving to BANK NIFTY or stocks.
BANK NIFTY moves faster and with wider average ranges than NIFTY, so CPR width on BANK NIFTY needs to be judged relative to its own recent history, not against NIFTY's typical range. A CPR gap that would be "wide" on NIFTY can still be "narrow" on BANK NIFTY. Traders new to BANK NIFTY intraday often carry over NIFTY-sized stop-losses, which are usually too tight for BANK NIFTY's volatility — size the stop to the instrument, not out of habit.
For options buyers, CPR bias decides which side of the chain you even look at — calls only above CPR, puts only below it — before theta decay and premium behaviour are even considered. For options sellers, a Wide CPR range-bound day is often the more favourable environment, since premium erosion works in the seller's favour when price stays contained rather than trending hard in one direction.
Don't confuse a good CPR bias with a good option trade — strike selection, expiry proximity and implied volatility still decide whether that directional read translates into a profitable options position. CPR tells you direction; it doesn't manage theta decay or IV crush for you.
Scanning a single stock's CPR by hand is easy. Scanning 200 F&O stocks for Narrow CPR, 2-day Narrow CPR, or CPR-breakout-with-volume setups every single morning is not something you want to do manually — which is exactly the gap a CPR scanner closes. A good scanner flags which stocks are showing compression (and are therefore breakout candidates) before the session opens, so your prep time goes into planning trades instead of scrolling charts.
Pre-market Narrow CPR routine
The setup tells you when a trade may be worth considering. Risk management tells you how much that idea is allowed to cost you. Entries in the Trading Direction CPR framework follow the same sequence every time:
Entry sequence
Before you think about the target, know exactly how much you're willing to lose if the setup fails. In the CPR framework, the stop-loss sits on the other side of the confirming structure — typically just beyond the retested TC/BC level or the breakout candle's low/high — not at an arbitrary points value picked after entry. If your stop-loss is ₹20 away, decide that risk before entering. Don't widen it to ₹30 simply because the trade is moving against you.
Targets are set using the next meaningful structure — the prior day's high/low, the next CPR level, a Virgin CPR zone, or a fixed risk-reward multiple of the stop distance, whichever comes first in the direction of the trade. A common baseline is a minimum 1:1.5 to 1:2 risk-reward before a trade is even considered — setups that only offer 1:1 or worse are usually skipped rather than force-fit.
Position size is a function of your stop distance and your fixed per-trade risk — never the other way around. Decide the rupee amount you're willing to risk per trade first (commonly a small, fixed percentage of trading capital), then divide by the stop-loss distance to arrive at quantity. This keeps every trade's risk consistent regardless of how "confident" a particular setup feels, which is exactly the discipline that prevents one bad trade from wiping out several good ones.
Where CPR trades usually fail
Market mein har breakout trade nahi hota — not every breakout deserves a trade. The setup being visible on the chart and the setup being tradeable with acceptable risk are two different questions, and beginners consistently answer only the first one.
A mistake we see repeatedly with new CPR traders: NIFTY opens above a Narrow CPR, gives a clean breakout candle above TC on decent volume, and the trader jumps in immediately. Price retests TC twenty minutes later, fails to hold, and closes back inside CPR — the trader is now stopped out on a trade that skipped the retest-confirmation step entirely. The same setup, entered after the retest held above TC instead of on the first breakout candle, would have avoided that loss and caught the actual trending move that followed into the afternoon.
On a Wide CPR day, the more common mistake runs the other way — a trader sees price push through BC and treats it like a breakout day, when the wider range was already signalling a choppier, fade-prone session. The move reverts back into the range within the hour. Reading CPR width correctly before the session, not just the level itself, is what separates these two outcomes.
CPR (Central Pivot Range) is a market structure tool calculated from the previous session's high, low and close. It's used to gauge trend bias and identify dynamic support and resistance zones for the next trading session.
Yes — CPR is widely used by intraday traders on NIFTY, BANK NIFTY and individual stocks to identify trend direction and breakout zones right from the start of the session.
A Narrow CPR forms when TC and BC are close together, signalling compression and often leading to a strong trending day. A Wide CPR forms when TC and BC are far apart, usually leading to a slower, more range-bound session.
Yes — CPR sets the structural bias, while VWAP and EMA confirm participation and short-term trend direction. Using all three together reduces the number of low-quality signals compared to using CPR alone.
CPR is useful for deciding which side of the option chain to focus on — calls above CPR, puts below it — but strike selection, expiry and implied volatility still need to be managed separately from the CPR bias itself.
Yes. CPR is one of the more beginner-friendly price action frameworks because it's visual and rule-based — Trading Direction's Beginners Corner course builds up from CPR basics before moving into advanced price action and options strategies.
CPR doesn't predict the market — it gives you a structure to react to it with. Bias tells you which side to look at, width tells you what kind of session to expect, and the retest tells you when to actually pull the trigger. Every rule on this page — entry, stop-loss, target, position sizing — exists to keep that process repeatable instead of emotional. Keep exploring the framework across our other Trading Direction blog articles, each of which links back to this page as the core CPR reference.
From free foundational content to advanced CPR price action, options buying/selling and Smart Money Concepts masterclasses — our courses are built around the same clarity-first approach that took Anil from a struggling retail trader to a full-time professional.
21,000+ students trained | Published author | 62K+ YouTube community
Explore Courses on Trading Direction →
See student results · Get the Android app
Disclaimer: This content is for educational purposes only and does not constitute investment, trading, or financial advice. Trading in the stock market involves risk. Please consult a registered financial advisor before making investment decisions.