Free Narrow CPR Stock Scanner: Daily Shortlist for Breakout Trades
Narrow CPR · Stock Scanner
There are no items in your cart
Add More
Add More
| Item Details | Price | ||
|---|---|---|---|
A practical framework for buying ITM Puts when Bank Nifty rejects Weekly CPR — confirmed using Daily CPR on the option's own premium chart, with a simple read on Delta, Gamma, and Vega.
When Bank Nifty spot trades above the Weekly CPR and fails to sustain, it often signals rejection rather than continuation — the setup for a Put buy. But spot rejection alone isn't a trigger. The confirmation comes from the option's own premium chart: when the Put premium moves above its Daily CPR, it shows real buying strength in the premium itself, not just a directional guess. Combine that with a rising Delta and increasing Gamma near the strike, and you have a higher-conviction ITM Put entry — with Vega telling you how much of that move is volatility-driven versus direction-driven.
Central Pivot Range (CPR) is a three-level pivot zone — Top Central (TC), Pivot (P), and Bottom Central (BC) — calculated from the previous period's high, low, and close, used to read whether price is likely to trend, reverse, or stay range-bound around that zone.
Most Bank Nifty options traders look at one chart before entering a Put — the spot chart. They see price above the Weekly CPR, assume resistance, and buy a Put the moment the first red candle shows up. Then the premium doesn't move the way they expected, even though the spot did fall.
The problem usually isn't the CPR read on spot. It's that the option's own price behaviour — the premium chart — was never checked. A Put premium has its own CPR, its own support and resistance, and its own confirmation signal that spot analysis alone can't give you. This article walks through how to combine both — spot Weekly CPR and options Daily CPR — with a practical, non-technical read on Delta, Gamma, and Vega, so the entry has two independent confirmations instead of one guess. This is one of the core reads taught inside the Options Trading Mentorship Program, session by session, on live charts.
This is a two-chart confirmation strategy, not a single-indicator strategy. You're not trading Bank Nifty spot directly — you're buying a Put option, and its premium doesn't move in a perfectly straight line with spot. It moves based on spot direction, time decay, and volatility, all at once. So confirming an options trade using only the spot chart's CPR ignores two of those three forces.
The core idea: use Weekly CPR on the spot chart to identify a rejection zone (bias), then use Daily CPR on the options premium chart to confirm that the premium itself is showing strength before you enter (trigger).
When Bank Nifty spot is trading above the Weekly CPR and then starts losing momentum — smaller green candles, wicks on top, inability to make a fresh high — that's early rejection. It doesn't mean short immediately. It means start watching for a confirmed move back through the CPR zone with volume, not just a single red candle.
A narrow Weekly CPR above current price behaving as resistance is a stronger signal than a wide CPR — a narrow CPR concentrates the pivot levels close together, which tends to produce sharper directional moves once price actually breaks one side. A wide CPR, on the other hand, often means more chop before a real move develops.
This is the part most traders skip. Plot a Daily CPR directly on the Put option's own premium chart — using the previous day's premium high, low, and close, the same way you'd calculate CPR on any price series. That gives the premium its own TC, Pivot, and BC.
When the spot is rejecting the Weekly CPR and, at the same time, the Put premium moves and holds above its own Daily CPR, that's your second confirmation. The premium isn't just rising because spot ticked down for one candle — it's showing sustained strength on its own chart. That's a materially stronger entry than reacting to spot alone.
Bank Nifty spot was trading with the Weekly CPR sitting above current price (BC near 57,800 / P near 57,760 / TC near 57,720) — a classic "Weekly CPR Above" read. Spot lost momentum around 57,600 and then broke down sharply, falling to roughly 57,290 within a few candles.
On the 57800 PE (25 Aug 2026 expiry) premium chart, the Daily CPR was sitting in a roughly ₹540–₹580 zone (TC ~₹540, P ~₹560, BC ~₹580) from the prior session. As spot broke down, the Put premium broke and closed above its own Daily CPR BC (~₹580) on a strong green candle — that break above the Daily CPR is the confirmed trigger, not the moment spot first turned red. From there the premium extended sharply, moving from the ~₹580 breakout zone to over ₹800 as the spot fall continued and Gamma accelerated the move.
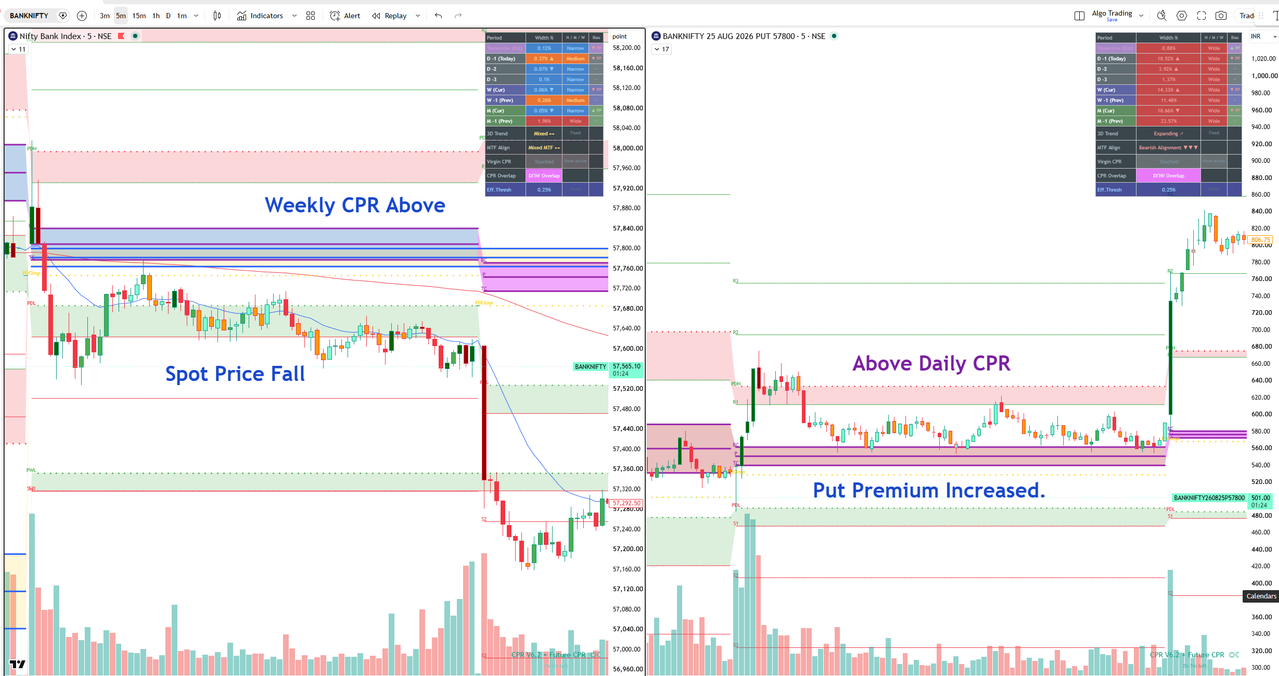
Live TradingView chart: Bank Nifty spot (left) rejecting Weekly CPR vs 57800 PE premium (right) breaking its Daily CPR — CPR V6.2 + Future CPR indicator.
Spot alone told you "price is below Weekly CPR now" — useful, but late. The premium's own Daily CPR breakout confirmed that the Put was gaining real strength on its own chart, at a point where spot was still only just cracking below its CPR zone. That's the two-chart edge this framework is built on.
A static chart shows the outcome. Watching the CPR levels and the premium reaction unfold candle by candle is what actually builds the read. These two live sessions walk through the same spot + options CPR process explained above.
Live Trading Example 1 — CPR-based Bank Nifty options entry
Live Trading Example 2 — spot + premium CPR confirmation walkthrough
Want to build this read under live guidance instead of just watching recordings? The Options Trading Mentorship Program works through setups like this one directly on your own charts, session by session.
You don't need the full Black-Scholes formula to trade this setup. You need to know what each Greek is telling you about why the premium is moving, so you don't confuse a genuine breakout with a volatility spike that fades.
An ITM Put typically has a Delta between roughly -0.55 and -0.80. That means for every 1-point drop in Bank Nifty spot, the premium gains roughly ₹0.55 to ₹0.80. This is why ITM options are preferred for buying in this setup — the premium moves in a way that closely tracks the spot move you're betting on, instead of barely reacting like a deep OTM option would.
Gamma is highest for options trading close to the money. As spot continues falling through the CPR zone, an ITM Put's Delta keeps increasing toward -1.0 — meaning the premium starts moving almost point-for-point with spot. This is the acceleration phase of the trade: the same size move in spot produces a bigger premium gain than it did a few points earlier.
When Bank Nifty breaks down sharply from a CPR rejection, implied volatility usually rises too — and Vega measures how much premium gain comes from that volatility expansion versus the actual spot move. This matters for exits: if spot stabilizes but volatility stays elevated, some of your premium gain is a Vega effect that can reverse quickly once volatility cools, even if spot doesn't recover.
Rejection at spot CPR (bias) + premium breakout above its own Daily CPR (trigger) + rising Delta and Gamma as spot falls further (acceleration) = a setup where the Greeks are working in your favour, not against you. If Delta is low and Vega is doing most of the work, the move is fragile — treat it that way with a tighter stop.
This isn't a rule to memorize blindly — it comes directly from how Delta, Gamma, and theta decay behave differently depending on which side of the trade you're on.
| Factor | ITM Option (Buying) | OTM Option (Selling) |
|---|---|---|
| Delta | High (0.55–0.80+) — premium tracks spot closely | Low (0.10–0.30) — smaller reaction to spot moves |
| Theta decay | Works against the buyer, but less severely than deep OTM | Works in the seller's favour — decay is the profit engine |
| Gamma risk | Rises as trade moves further ITM — helps the buyer | Can spike suddenly if price moves toward the strike — hurts the seller |
| Capital/margin | Higher premium outlay, defined risk (premium paid) | Lower premium received, undefined risk unless hedged |
| Why it fits this setup | You want the premium to move with conviction once both CPRs confirm | You want decay + limited directional exposure away from the CPR zone |
Buying the Put the moment spot touches the Weekly CPR from above, without waiting for the premium's own Daily CPR confirmation. sometime Premium may be trading below S1, Spot can wick into a CPR zone and reverse straight back up — a single rejection candle is not the same as a sustained breakout. Traders who skip the premium-chart CPR indicator confirmation end up holding a Put through a fakeout, watching theta decay eat the premium while spot chops sideways.
Treat the spot Weekly CPR rejection as your watchlist trigger, not your entry trigger. Only enter once the option's own Daily CPR on the premium chart is also broken and holding. This costs you a small amount of the initial move, but it removes most single-candle fakeouts from your entries.
The setup tells you when a Put may be worth considering. Risk management tells you how much that idea is allowed to cost you.
The CPR Brahmastra Strategy webinar covers spot + options CPR confirmation, Greeks reads, and risk sizing in detail — every Sunday.
Join the Live WebinarThe Options Trading Mentorship Program takes you through setups like this one on your own trading account, with direct feedback on your entries and risk sizing.
Explore the Mentorship ProgramYes — the same logic applies in reverse. When Bank Nifty spot holds and breaks above the Weekly CPR with strength, and the ATM/ITM Call premium breaks above its own Daily CPR, that's the equivalent confirmed entry for a Call buy. I given example on you tube video course, or upgrade to Mentorship Program.
AFter CAS Rule, Future and Options Chart became more important,. Because the option premium is influenced by Delta, Gamma, theta decay and Vega — not spot price alone. A spot signal can be technically correct while the premium still doesn't move favourably if IV contracts or theta decay offsets the directional gain. The premium's own CPR filters for that.
Not always — ITM suits this CPR-confirmation setup because you want the premium to track spot closely once both charts confirm. In lower-conviction or purely speculative setups, some traders accept OTM's cheaper premium and higher percentage-return potential, with the trade-off of lower Delta and faster theta decay.
The same CPR formula used on spot — Pivot = (High + Low + Close) / 3, using the previous session's premium high, low and close — plotted directly on the option's own candlestick chart, separate from the underlying's CPR.
Paying a higher premium upfront and being wrong on timing — if spot reclaims the Weekly CPR quickly, theta decay plus a reversing Delta can shrink the premium faster than a cheaper OTM position would have. This is why the invalidation rule (Section 8) matters as much as the entry rule.
Gamma and theta behave much more aggressively on expiry day, so premium moves can be sharper in both directions. The same CPR-confirmation logic applies, but position sizing should be reduced given the faster Gamma acceleration near expiry.
A single CPR read on the spot chart tells you where price might reject. It doesn't tell you whether the option you're about to buy is actually moving with conviction. Plotting Daily CPR directly on the premium chart, and waiting for that second confirmation, turns a directional guess into a two-chart, Greeks-aware entry — the same process that separates a good setup on paper from a good trade in practice.
If you want to practice this side by side on live charts before risking capital, the CPR Brahmastra webinar walks through both spot and options CPR reads every week, or browse the full course library for structured, risk-first options training.
Published May 13, 2026 · Written by Anil Hanegave