Narrow CPR Scanner Free Tool — Daily & Weekly NSE Bhavcopy Scanner
Narrow CPR · Stock Scanner
Read article →
There are no items in your cart
Add More
Add More
| Item Details | Price | ||
|---|---|---|---|
Strike walls, OI change, PCR and a worked trade plan, explained on a real intraday Nifty OI chart.
To read open interest data, look at three things together: where OI is concentrated by strike, how it changed during the session, and where price is sitting against those strikes. Heavy put OI below the market hints at support, heavy call OI above hints at resistance, and the change in OI tells you whether those walls are getting stronger or breaking down.
Open interest (OI) is the total number of futures or options contracts that are still open, meaning not squared off and not expired. It rises when fresh positions are created, falls when positions are closed, and stays flat when one trader simply replaces another. Volume counts what traded today; OI counts what is still alive.
Learning how to read open interest data changes how you look at an option chain. Price shows you where the market is. OI shows you where participants have committed money, and that is often where the market stalls, bounces or breaks. I like to trade options in Nifty 50, and OI is one of the first things I check because it turns a wall of numbers into levels I can actually plan around.
OI is not a prediction tool. It describes positions, not intent. The skill is in reading the change, comparing it with price, and knowing when the data is too noisy to trust.
Price direction plus OI direction gives four classic readings: long build-up, short build-up, short covering and long unwinding. Rising OI means fresh money is entering; falling OI means positions are being closed.
| Price | OI | Reading | What to check next |
|---|---|---|---|
| Up | Up | Long build-up | Does volume confirm? Is price holding above support? |
| Down | Up | Short build-up | Is it fresh selling or hedging? Check the call and put sides separately. |
| Up | Down | Short covering | Moves driven by covering often lose steam quickly. |
| Down | Down | Long unwinding | Look for OI to stabilise before calling a bottom. |
Common mistake: applying this table to options without thinking. In options, OI sits at each strike on both sides, so a rise in call OI is not automatically bearish. It depends on whether those contracts were bought or written, which is why the premium must be checked too.
An OI change chart plots put and call open interest at every strike and shows how it moved during the session. Solid bars are the OI that remains, hatched bars are an increase, and outlined bars are a decrease. Read it left to right from support to resistance, with the dotted line marking spot.
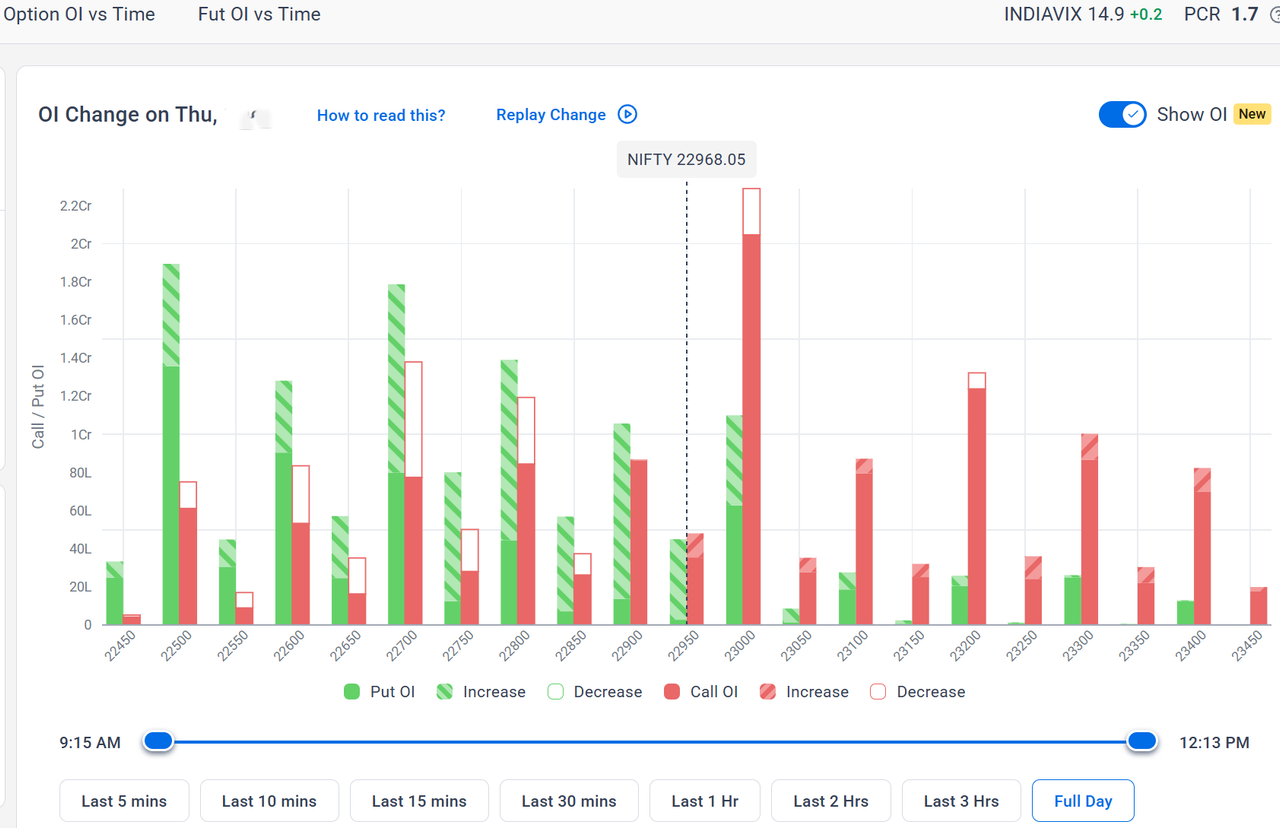
Spot Nifty is 22,968.05, India VIX is 14.9 (up 0.2) and PCR is 1.7. The dotted line sits just below 23,000, so price is pressing against the biggest red bar on the chart.
On this chart, put OI rose sharply at 22,700 to 22,900 while call OI was closed below spot, and the heaviest call wall sits at 23,000. That points to a market with support rising towards spot and resistance concentrated just above it.
The figures below are my approximate visual readings of the chart, in Cr (crore) and L (lakh). Treat them as illustrative, and confirm exact numbers on the NSE option chain.
| Strike | Put OI now | Put change | Call OI now | Call change | Read |
|---|---|---|---|---|---|
| 22,500 | ~1.9Cr | +55L | ~0.62Cr | -13L | Strong base, calls closing |
| 22,700 | ~1.8Cr | +99L | ~0.78Cr | -60L | Heaviest fresh put build, call wall removed |
| 22,800 | ~1.4Cr | +96L | ~0.85Cr | -35L | Support stacking up |
| 22,900 | ~1.05Cr | +92L | ~0.87Cr | No visible change | Fresh put build nearest to spot |
| 23,000 | ~1.1Cr | +47L | ~2.05Cr | -24L | Biggest call wall, slightly weakening |
| 23,200 | ~0.25Cr | Small | ~1.22Cr | -9L | Next resistance |
| 23,300 | ~0.26Cr | Small | ~1.0Cr | +13L | Fresh call build higher up |
Common mistake: assuming every put OI increase means bullish put writing. Put buying for hedging also adds OI. Practical fix: check whether put premiums fell while OI rose (writing) or rose with OI (buying).
The strike with the largest put OI below spot is a likely support zone, and the strike with the largest call OI above spot is a likely resistance zone. These are zones, not exact lines, and they matter only while the OI holds.
A wall is strong when it is large, was built today, and price has not yet pushed through it. It is weakening when outlined bars appear on top of it and price keeps testing it. In this example, 23,000 call OI is still huge but about 24L has already closed, so I would watch whether that unwinding continues as price approaches.
An OI trade plan uses the walls as boundaries: enter near support after confirmation, keep the stop loss beyond the wall, and place the target just before the opposite wall. All numbers below are illustrative and not a recommendation.
| Element | Illustrative plan |
|---|---|
| Concept | Put support at 22,900 is fresh; call wall sits at 23,000 |
| Entry | 22,925, after a candle closes back above 22,900 |
| Confirmation | Put OI at 22,900 holds or grows, spot stays above it |
| Stop loss | 22,885, below the put support zone |
| Target | 22,990, just under the 23,000 call wall |
| Risk-reward | Risk 40 points, reward 65 points, RR about 1:1.6 |
| Position size | Capital Rs 5,00,000, risk 1% = Rs 5,000. Quantity = 5,000 / 40 = 125 units, rounded down to whole lots (verify the current NSE Nifty lot size) |
| Invalidation | Spot closes below 22,885, or put OI at 22,900 starts closing |
If price breaks above 23,000 while call OI there keeps closing, the resistance idea is invalid. That is the moment to step aside rather than argue with the chart.
| Mistake | Practical fix |
|---|---|
| Treating OI as a prediction | Use it as a map of levels, then wait for price to confirm |
| Ignoring change in OI | Always compare solid, hatched and outlined bars |
| Assuming all call OI is bearish | Check premium behaviour to separate writing from buying |
| Reading OI in the first 15 minutes | Wait until the session has built real data |
| Ignoring expiry and rollover effects | Be cautious near expiry, when OI moves between series |
| Using OI without price levels | Combine OI with CPR, VWAP and support and resistance |
It is the count of futures or options contracts that are still open. It rises with fresh positions and falls when positions close.
Volume is how many contracts traded in a period. OI is how many remain open. Volume resets daily, OI carries forward.
No. High call OI often acts as resistance, but it can break if price pushes through and call writers close their positions. Watch the change in OI.
It means put OI is higher than call OI. It is often read as supportive, but very high readings can show crowded positioning, so use it as context only.
Not by itself. Rising OI means fresh positions. Whether it is bullish or bearish depends on price direction and on whether calls or puts are being added.
The NSE option chain and most broker platforms show strike-wise OI. Verify figures on the official NSE site before trading.
Find the walls, read how they changed, and let price confirm. On this chart, support stacked at 22,700 to 22,900 and the call wall sat at 23,000, which gave a clear range to plan around. When the walls are unclear, the best trade is often no trade.
More lessons: Trading Direction blog.