Free Narrow CPR Stock Scanner: Daily Shortlist for Breakout Trades
Narrow CPR · Stock Scanner
There are no items in your cart
Add More
Add More
| Item Details | Price | ||
|---|---|---|---|
As reported by ANI, the US 10-year Treasury yield crossed 5.10 per cent on 24 September 2026, and Indian indices opened sharply lower, with private banks and financial services among the biggest decliners. That pressure outweighed the usual positive effect of cheaper crude oil. This article also looks back at what the CPR and price action structure looked like on the charts, purely as a learning exercise. It is a hindsight study, not a prediction or a trading call.
A popular market rule says: when crude oil falls, Nifty rises. India imports the bulk of its crude oil, so cheaper crude is usually seen as supportive for inflation, the rupee and market sentiment.
On 24 September 2026, that relationship did not hold. Crude oil corrected on MCX, yet the Nifty fell sharply. This is a good moment to learn why single correlations are unreliable, and how traders study CPR (Central Pivot Range) and price action to understand market context.
Indian benchmark indices opened sharply lower as investors digested the surge in US bond yields. According to ANI, the US 10-year Treasury yield crossed 5.10 per cent, and several yields touched their highest levels since 2007. Stronger-than-expected US business activity, growing at its fastest pace in more than five years, raised expectations of an interest rate hike next month.
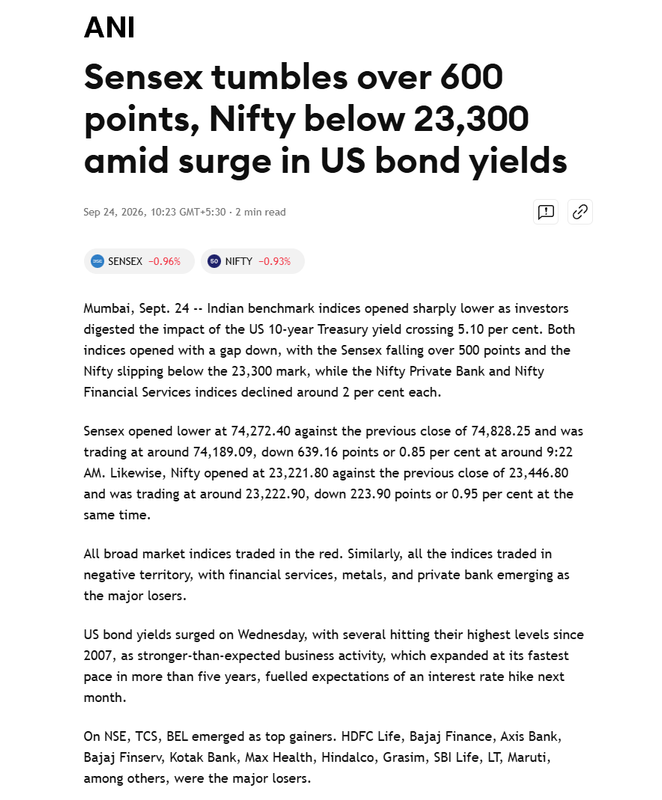
| Index | Previous Close | Opening | Move around 9:22 AM |
|---|---|---|---|
| Sensex | 74,828.25 | 74,272.40 | Down 639.16 points (about 0.85%) |
| Nifty | 23,446.80 | 23,221.80 | Down 223.90 points (about 0.95%) |
Figures as reported by ANI. Shown only to describe the news event.
By sector, financial services, private banks and metals were the major losers, with the Nifty Private Bank and Nifty Financial Services indices falling around 2 per cent each, as reported.
The MCX Crude Oil chart below shows that crude had already corrected from the 9,600 zone towards the 8,400 area, before bouncing and consolidating near 8,700 to 8,800. Normally, cheaper crude is viewed as supportive for India. This time, a bigger driver overpowered a smaller one.
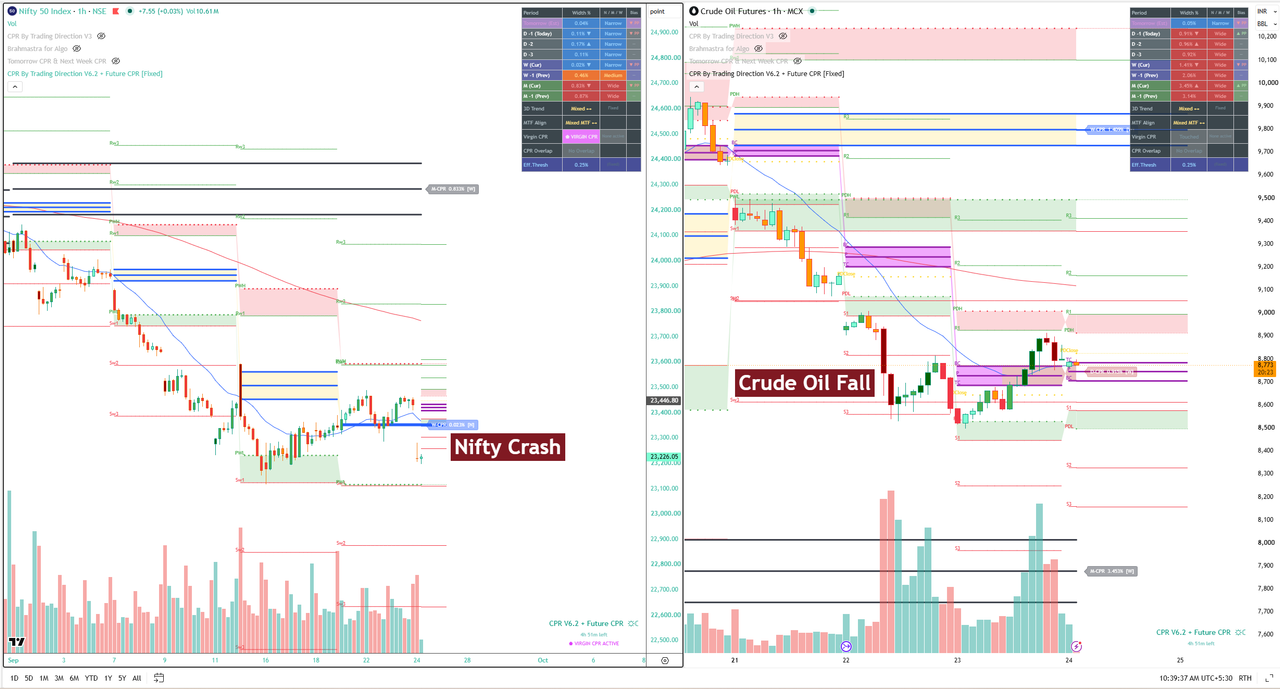
Crude oil is one input for the Indian market. US bond yields, the dollar, FII (foreign institutional investor) flows and interest rate expectations are also inputs. When US yields rise sharply, money can move away from emerging markets like India, and rate-sensitive, FII-heavy sectors such as private banks and financials are often affected the most. That is consistent with the sector moves reported by ANI on 24 September 2026.
The news arrived on the morning of 24 September. Looking back at the charts, here is what a student of CPR (Central Pivot Range) could observe. These are hindsight observations for learning, not predictions.
On the Nifty 1-hour chart, price had been forming lower highs and lower lows since early September, moving from the 24,400 region towards the 23,200 zone. Price structure like this is what technical students call a downtrend structure.
The CPR dashboard showed the daily and weekly widths in the Narrow category. Weekly CPR width was about 0.02%, and daily widths ranged from 0.04% to 0.17%. A narrow CPR shows that the previous period's range was compressed, which is often associated with a higher chance of a directional move. It does not show direction, and it does not guarantee that a move will follow.
Nifty tried to recover towards the weekly CPR zone but did not build acceptance above it. Students study such behaviour to understand how price reacts around CPR levels.
On MCX Crude Oil, price moved down through its CPR zone, reached lower support levels and then bounced. Crude's weekly and monthly CPR widths were wide, showing a more volatile structure than Nifty. Two charts with two different structures is a useful reminder that a simple "crude down, Nifty up" story may not always hold.
| Chart observation (in hindsight) | What students learn from it |
|---|---|
| Lower highs and lower lows on Nifty | How to identify trend structure |
| Narrow daily and weekly CPR | How CPR width relates to range compression |
| Price not holding above weekly CPR | How price reacts around key levels |
| Crude falling but Nifty not rising | Why single correlations are unreliable |
News explains a move after it becomes public. Price action shows how the market has been behaving up to that point. In this case, the weakness on the Nifty chart was visible before the ANI headline, but that is a single example and one observed after the fact.
Our teaching philosophy at Trading Direction is simple: study what the chart is showing, and understand the news as context, not as a signal.
One case study is not proof. CPR does not predict news, and a narrow CPR does not show direction by itself. Some narrow CPR days end in false moves, and news can surprise even the cleanest chart. This article makes no claim about returns or performance of any tool or strategy, and it does not suggest any trade.
As reported by ANI, the US 10-year Treasury yield crossed 5.10 per cent on 24 September 2026, with several US yields at their highest since 2007. Indian indices opened sharply lower, with private banks and financial services among the biggest decliners. That pressure outweighed the usual positive effect of cheaper crude oil. When a bigger global driver appears, the usual crude oil and Nifty relationship can break.
According to ANI, the Sensex opened at 74,272.40 against a previous close of 74,828.25 as investors reacted to the surge in US bond yields and expectations of an interest rate hike next month. Financial services, private banks and metals were the major losing sectors.
No. India imports most of its crude oil, so lower crude is usually considered supportive for the market. But the relationship is not fixed. Global bond yields, the US dollar, foreign fund flows and interest rate expectations can overpower it, as seen on 24 September 2026.
CPR, or Central Pivot Range, is a price-based tool made of three levels (the pivot, top central and bottom central) calculated from the previous period's high, low and close. Learners use it to study market structure, support and resistance zones, and whether a session may be trending or range-bound.
A narrow CPR indicates that the previous period's range was compressed, which is often associated with a higher chance of a directional move. It does not indicate the direction, and it does not guarantee that a move will happen.
No. CPR does not predict news, and it does not guarantee any market outcome. It is a tool for studying price structure. Any chart observation in this article is a hindsight case study for learning, not a forecast.
No. This article is for stock market education only. It is not investment advice, a research report or a recommendation to buy, sell or hold any security. Please consult a SEBI-registered Investment Adviser before making investment decisions.
The charts in this article use the CPR By Trading Direction indicator on TradingView, which shows daily, weekly and monthly CPR width and related information in one dashboard.
Want to understand CPR, price action and multi-timeframe analysis in a structured way? Explore our educational courses and free learning resources at tradingdirection.in.
Disclaimer
This article is published by Trading Direction for stock market education and general information only. It is not investment advice, research analysis, a research report or a recommendation, solicitation or offer to buy, sell or hold any security or financial product. No buy or sell call, target, stop loss or price forecast is given or implied.
Observations on charts are hindsight illustrations for learning. They are not predictions, and no claim is made about returns, accuracy or performance of any indicator, tool or strategy. Past performance does not indicate future results.
Investments in the securities market are subject to market risks. Read all related documents carefully before investing. Trading in derivatives, options and commodities carries a high risk of loss.
Readers should consult a SEBI-registered Investment Adviser and verify any adviser's registration on the SEBI website (sebi.gov.in) before making investment decisions. Trading Direction and the author do not accept liability for any loss arising from the use of this content.