CASE STUDY | CPR + OI + LIQUIDITY
No News, Still a 200+ Point Fall: How CPR, OI Data and a Liquidity Trap Revealed a Trending Day
A Nifty trading session with no fresh headline and no special announcement. The fall came from market structure, and it was visible before the move.
QUICK SUMMARY
Many traders believe a big fall needs big news. In this historical example the geopolitical backdrop was unchanged and there was no fresh tariff or policy announcement that we could see. Yet Nifty fell more than 200 points in the first hour. The reason was structure: a Virgin CPR above, bearish multi-timeframe alignment, a trap and liquidity grab at the previous day's low, and fresh call writing just above spot that rejected every bounce. The OI data showed the trending character of the day. For traders, knowing the difference between a news-driven day and a structure-driven day changes how you plan, size and manage the trade.
The Setup: A Fall With No Fresh Trigger
The war-related backdrop was already known to the market, and there was no new tariff announcement or surprise event that morning. Even so, Nifty opened weak, broke below key levels and kept making lower highs. Beginners often say "market fell because of the news". Experienced traders ask a better question: "Where were the levels, and who was trapped?"
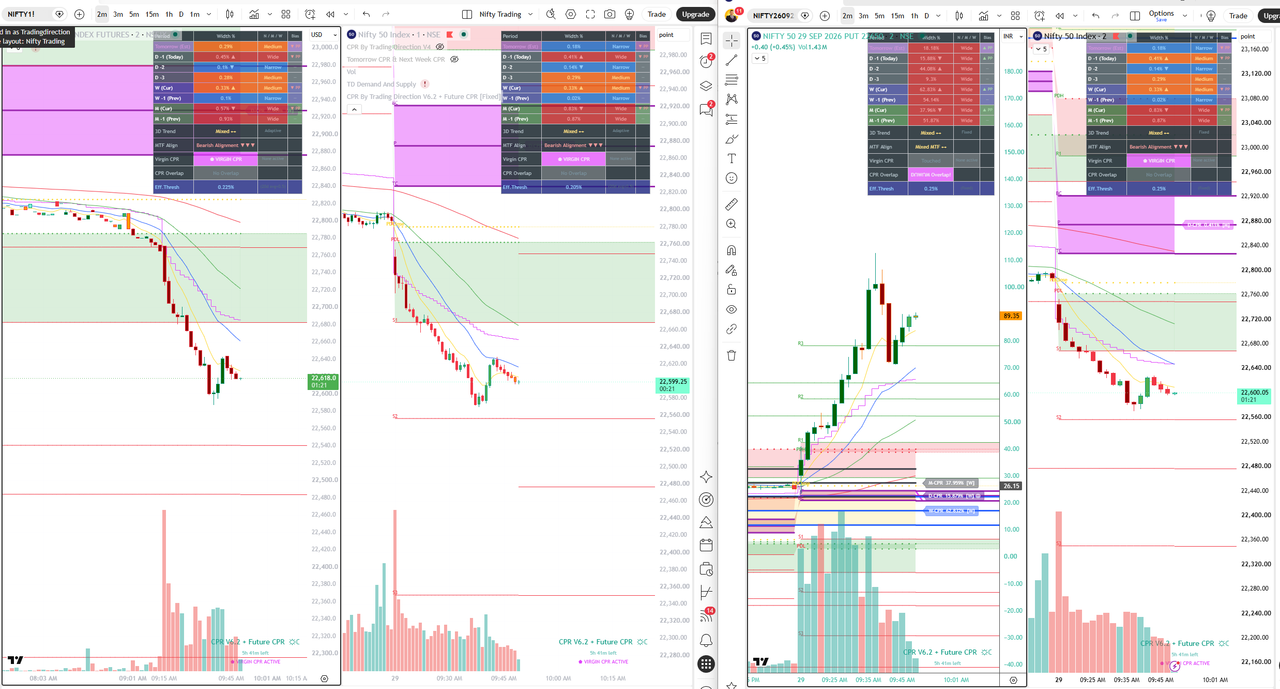
Four-chart view (Futures, Spot, 22650 PUT, Spot) with CPR V6.2. Bearish alignment, Virgin CPR above, price below PDL and S1. First hour of the session.
Step 1: What CPR Had Already Shown (WDP Sequence)
Following the WDP Sequence (Weekly CPR, then Daily CPR, then Price match), the dashboard gave a clear read before the market moved:
- Previous week CPR was very narrow (Spot about 0.02%, Futures about 0.1%). A narrow weekly CPR (Sankuchit CPR) points to a bigger directional move.
- MTF Align: Bearish Alignment with three down arrows. Multiple timeframes agreed.
- Virgin CPR active. Price had never traded through it, so it stayed as untested resistance (Rukavat) above.
- Price below CPR from the open, then PDL and S1 broke and price reached the S2 area.
None of this needed a news headline. It was on the chart the night before.
Step 2: The Trap and the Liquidity (Fasa Hua Trader)
Every obvious level has orders sitting around it. On this day the obvious levels were PDL and S1, where many traders expect a bounce. Here is how the trap worked, in our reading of the chart:
1
Obvious support. Price falls to PDL and S1. Dip buyers enter, expecting support to hold. Their stop-losses sit just below.
2
Liquidity taken. Price breaks below those levels. Buyer stop-losses trigger and become market sell orders, which adds fuel to the fall.
3
Bounce to the wall. Price bounces from the S2 area towards 22,640. Late dip buyers and short-coverers get excited.
4
Rejection. The bounce meets fresh call writing at 22650 to 22700 and the falling moving averages. It fails, and a second group of buyers is trapped.
Step 3: The OI Data That Showed a Trending Day
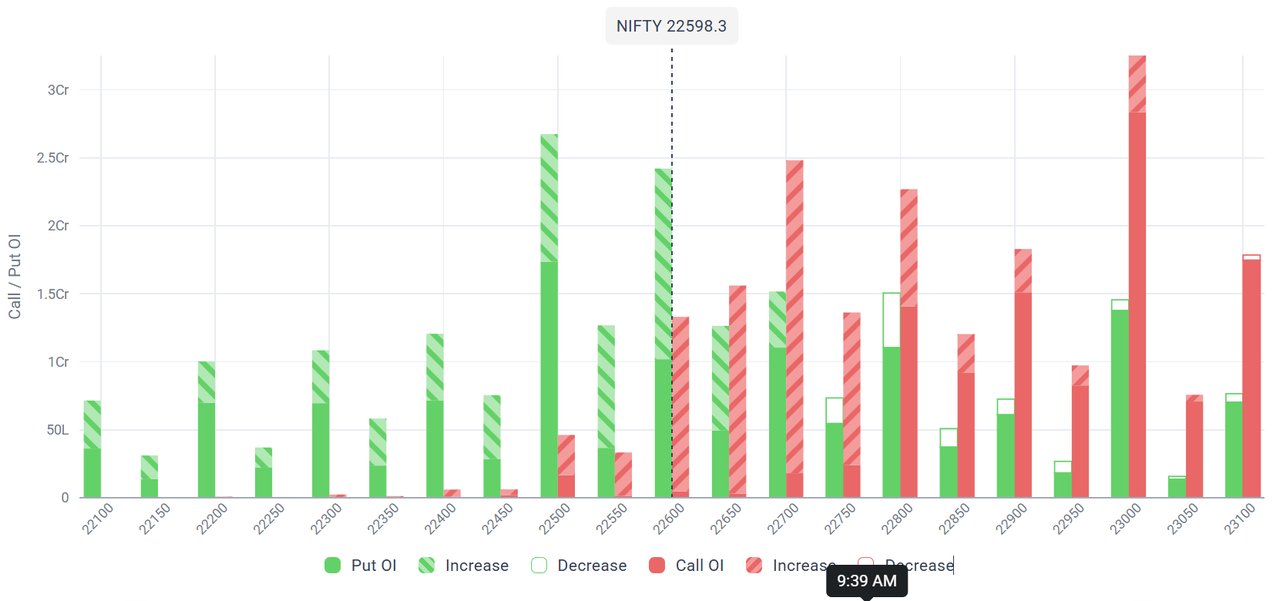
Nifty Call / Put OI by strike (Nifty 22,598.3, early in the session). Hatched bars are fresh additions.
A simplified ladder of the key strikes (approximate values read from the chart):
NIFTY SPOT 22,598
22500 PE
~2.7 Cr | fresh + existing
How to read this as a trend-day signature
- Fresh call wall right above spot. Heavy new Call OI at 22650 and 22700 (Call Writing, or Call Bechna) sits 50 to 100 points above price. Any pullback runs straight into sellers.
- Bigger walls further up. 22800 and 23000 CE hold large OI, so sellers were positioned for a lower close, not a quick scalp.
- Put writers defending lower zones. Fresh Put OI at 22600, 22550 and 22500 marks where the market may pause. It defines the corridor, and it is not a reason to fight the trend.
- Read the hatched bars. Existing OI is history. Fresh OI shows who is acting today.
How the pieces fit: CPR gave the map (where the market could move). OI gave the positioning (who was on which side and where pullbacks would be sold). Price action gave the trigger (level breaks and rejections). Use all three together. OI alone is never the entry.
Step 4: Option Premium Agreed
The 22650 PUT (third panel) rose from the mid-20s to a high near the 100+ zone in the first hour and held well above its lows even after the bounce. When the index makes lower highs and lower lows while Put premium keeps making higher lows, the options market agrees with the price chart.
The Big Difference for Traders: News-Driven Day vs Structure-Driven Day
News-Driven Day
A surprise headline or announcement moves the market. Gaps are sudden, levels are often ignored for a while, and OI changes look chaotic. Direction is hard to plan in advance.
Structure-Driven Day (this case)
No fresh trigger. The move respects pre-marked levels, stop-loss hunts happen at obvious zones, and fresh OI builds near spot. The map was available before the open.
| What you check | News-Driven Day | Structure-Driven Day |
|---|
| Trigger | Fresh headline or announcement | None, or an old known backdrop |
| Levels (CPR, PDH/PDL, S/R) | Can be overrun quickly | Respected, with clear breaks and rejections |
| OI behaviour | Sudden and messy shifts | Fresh writing builds near spot and caps pullbacks |
| Best preparation | Smaller size, wait for the market to settle | Pre-plan levels, trade breaks and pullbacks with defined stop-loss |
| Common mistake | Predicting the headline | Buying the "obvious" support and getting trapped |
Why this matters: if you blame the news for every fall, you will never build a repeatable process. If you can identify a structure-driven day, you can prepare in advance, plan entries at levels, and avoid being the trapped trader.
5-Point Trending Day Checklist
- Weekly CPR: Was last week narrow? Does MTF alignment point one way?
- Daily CPR: Is price opening and holding fully on one side? Is a Virgin CPR in play?
- Price and liquidity: Did PDH/PDL and S1/R1 break, with stop-loss hunts and failed bounces?
- OI: Is fresh writing building close to spot on the side that caps pullbacks? Where is the opposite-side defence?
- Premium: Do CE and PE charts agree with the index?
If four or five agree, treat it as a trending day setup. If only one or two agree, treat it as a normal day.
Common mistakes to avoid
- Trading OI alone. OI this early in the session can change later in the day. Use it to confirm, not to lead.
- Placing stop-loss on OI strikes. Stops and entries belong on price levels (CPR, candle closes, PDH/PDL).
- Buying the obvious support. The most visible level is where stop-losses cluster.
- Chasing after the big move. Plan entries at pullbacks near your levels.
Frequently Asked Questions
Can the market fall sharply without any news?
Yes. Levels, stop-loss clusters and positioning (OI) can drive strong moves even without a fresh headline. This is why marking levels in advance matters.
What is a liquidity trap in trading?
Price moves through an obvious level (like PDL) where many stop-losses sit. The triggered stops add momentum to the move and trap traders who entered at that level.
How does OI help identify a trending day?
Fresh OI building on one side close to spot, especially with larger walls further away, shows where pullbacks are likely to be sold or bought. Combine it with CPR structure and price action.
What is a Virgin CPR?
A CPR that price has not yet traded through. It often acts as strong, untested support or resistance.
Is this a trade recommendation?
No. This is a historical case study for education. Every day is different.
Disclaimer: This content is for educational purposes only and is not investment advice or a recommendation to buy or sell any security. The charts and OI data are shown as a historical case study, and past behaviour does not guarantee future results. Explanations of why the market moved reflect our chart-based interpretation and are not statements of fact about market causes. Trading in Futures and Options involves substantial risk, and SEBI studies have shown that a large majority of individual F&O traders incur losses. Please consult a SEBI-registered advisor before making decisions.