Free Narrow CPR Stock Scanner: Daily Shortlist for Breakout Trades
Narrow CPR · Stock Scanner
There are no items in your cart
Add More
Add More
| Item Details | Price | ||
|---|---|---|---|
Price alone never tells you who's in control. Add Open Interest (OI) and the same candle starts telling a completely different story.
In Futures & Options (F&O) trading, every price move can be read two ways depending on what Open Interest (OI) is doing alongside it. Learning to read Price + OI together is one of the fastest ways to stop guessing and start reading what large positions are actually doing.
There are only four possible combinations of Price direction and OI direction. Each one has a name and a meaning:
Fresh long positions (नई खरीदारी) are being added as price rises. Buyers are confident and committing new money — the strongest bullish signal in OI analysis.
Fresh short positions (नई बिकवाली) are being added as price falls. Sellers are confident and initiating new bets on further downside.
Existing shorts are being bought back (position exit), pushing price up. This is often a sharp, fast move — but it's an exit, not necessarily fresh conviction.
Existing longs are being sold off (profit booking or stop-loss exits), pushing price down. Also an exit — not necessarily fresh bearish conviction.
A typical Fut OI vs Time chart plots daily Futures OI as bars, color-coded by buildup type, with the underlying index overlaid as a line — so you can see price and OI shift together, day by day.
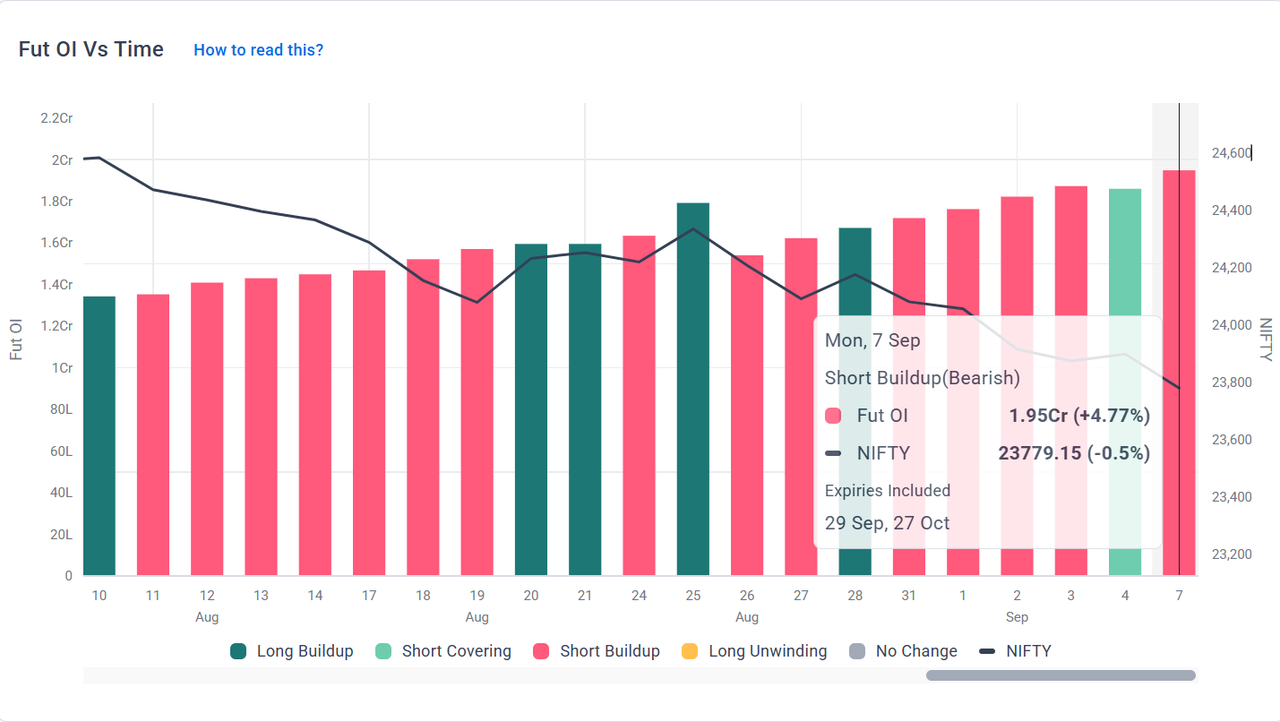
Illustrative Fut OI vs Time layout — teal bars: Long Buildup, red bars: Short Buildup, mint bars: Short Covering, amber bars: Long Unwinding, grey bars: No Change
| Bar Color | Buildup Type | What It Means That Day |
|---|---|---|
| Teal | Long Buildup | Fresh buying, OI rising with price — bullish continuation day |
| Red | Short Buildup | Fresh selling, OI rising with price falling — bearish continuation day |
| Mint / Light Green | Short Covering | Shorts exiting, OI falling with price rising — often a sharp relief move |
| Amber | Long Unwinding | Longs exiting, OI falling with price falling — profit booking, not fresh bears |
| Grey | No Change | Position build roughly flat — indecisive session |
A common beginner mistake is treating OI, PCR, or Max Pain data as a standalone buy/sell signal. It isn't. OI tells you what kind of participation is behind a move — it doesn't tell you where to enter or exit.
Practically, that means: if price is rejecting a CPR level and OI shows a Short Buildup on the same move, that's confirmation to trust the setup — not a reason to enter purely because OI looked bearish.
| Signal | Price | OI | Bias |
|---|---|---|---|
| Long Buildup | Up | Up | Bullish — fresh conviction |
| Short Buildup | Down | Up | Bearish — fresh conviction |
| Short Covering | Up | Down | Bullish — exit-driven, watch for fade |
| Long Unwinding | Down | Down | Bearish — exit-driven, watch for fade |
Long Buildup happens when price rises and Open Interest (OI) rises together. It means fresh long positions (नई खरीदारी) are being added, signalling bullish conviction from buyers rather than short-covering.
Short Buildup happens when price falls and OI rises together. It means fresh short positions (नई बिकवाली) are being added, signalling bearish conviction from sellers.
Both push price up, but Long Buildup is driven by fresh buying (OI rises), while Short Covering is driven by existing short sellers exiting their positions (OI falls). Short Covering moves are often sharper but can fade faster since they're exit-driven, not fresh conviction.
High or rising OI is neither bullish nor bearish on its own — it only tells you that positions are being added. You must read it together with price direction: rising OI with rising price is bullish (Long Buildup), while rising OI with falling price is bearish (Short Buildup).
No. OI, PCR, and Max Pain should be used as confirmation tools, not as standalone entry triggers. Price action — CPR levels, candle closes, TC/BC zones — should anchor every entry, stop-loss, and target decision.
Long Buildup and Short Buildup tell you where fresh conviction is entering the market. Short Covering and Long Unwinding tell you where existing positions are exiting. Read them alongside CPR-based price levels — never in isolation — and OI stops being confusing jargon and starts being a genuine confirmation tool.
Learn to combine OI, PCR and Max Pain as confirmation alongside CPR-based location trading — live, with a mentor.
Join the Mentorship Program Visit the StoreDisclaimer: This content is for educational purposes only and does not constitute investment advice, a recommendation, or a solicitation to buy or sell any security. Any chart shown is illustrative of the OI-buildup concept and not a live trading signal for any specific date. Trading in Futures & Options is subject to market risk. Please consult a SEBI-registered investment advisor before making any investment decisions.