Narrow CPR Scanner Free Tool — Daily & Weekly NSE Bhavcopy Scanner
Narrow CPR · Stock Scanner
Read article →
There are no items in your cart
Add More
Add More
| Item Details | Price | ||
|---|---|---|---|
A complete guide to Nifty open interest data and the Open Interest Change graph: what hatched and hollow bars mean, why a heavy call strike such as 23000 can cap price, how to confirm it with CPR, and how to trade it with defined risk.
A strike acts as resistance when it holds a very large call open interest and that call OI keeps increasing. Big players are then selling calls there, and they defend the level. On the Open Interest Change graph, look for tall red bars with hatched tops above the current price.
Open interest (OI) is the total number of option or futures contracts that are still open and not yet closed. Traders also call it open OI data, because it counts positions that remain open. It is a count of live positions, not a count of trades. If I sell one call to you and you buy it, OI rises by one. If you later sell it back to me, OI falls by one.
Volume is different. Volume counts every trade made during the day. A strike can have high volume and low OI if traders open and close within minutes. Intraday traders (1 din ka trade) often confuse the two. I tell my students: volume shows activity, OI shows commitment.
Every option contract has a buyer and a seller. The seller is called the writer. When we say call OI is rising at a strike, we are saying more call contracts were created there. The chart cannot tell us who is long and who is short in each trade, but a very large OI at one strike tells us that the strike matters to many participants. That is why a strike can become a reference level for the whole market.
Before the market opens, most of my students search for "oi data nifty", "oi data NSE" or "open interest data NSE". The primary source is the NSE option chain. It lists call OI, put OI, change in OI and volume at every strike. Many platforms, including Sensibull and several broker tools, take the same exchange numbers and redraw them as an OI data chart. A chart lets you see the walls at a glance, while a table makes you read every row. Trading Direction is not affiliated with any of these platforms, and you can use whichever one you prefer.
Open interest data live views refresh during market hours. A chart saved at 9:30 AM can look very different by noon, so always note the time of your snapshot. I never compare a morning screenshot with an afternoon level without checking the change in OI first.
The method is identical for both indices. Nifty 50 option data comes from NSE, and Sensex option data comes from BSE. The same hatched and hollow bars apply, and the same support and resistance logic applies. Just keep the strikes separate, because a Nifty strike means nothing on a Sensex chart.
Used this way, open interest works as an open interest indicator for support and resistance zones, whether you read Nifty or Sensex. It is not a buy or sell signal on its own, and I treat open interest analysis as one input among several.
Think from the seller's side. An option writer collects premium and keeps it if price stays below the strike. Their loss grows if price rises above it. A writer with a large call position at 23000 wants Nifty to stay under 23000 at expiry.
To protect that position, writers act when price approaches the strike. Some sell futures as a hedge. Some buy back calls and then sell again at better prices. Some add more calls when they are confident in the level. This repeated supply near the strike makes it harder for price to move up through it. Traders call the result a call wall.
The same logic works in reverse for puts. A heavy put strike below price is a floor, because put writers defend it. Between the two walls, the market often moves in a range. This is why option data is useful as a Leading Indicator of levels. The strikes with big OI are known before the move happens. Candles only show the reaction after it.
Important: OI shows where positions are concentrated. It does not guarantee a reversal. Walls can be defended, rolled, hedged or abandoned. I always use OI with price and CPR before I take a trade.
The Open Interest Change graph is an open interest chart, also called an OI data chart, with a Show OI toggle. The same open interest data can be viewed in two ways, and you should know both.
The solid bar is the total outstanding OI at that strike. Red is call, green is put. The change since the previous close is drawn inside the bar.
Only the change is plotted around a zero line. A red bar above the axis is call OI added. A green bar above is put OI added. A red bar below is call OI removed. A green bar below is put OI removed. The meaning is the same, with less clutter.
Here is a real snapshot I saved from the Nifty option chain graph (16 October 2026, 9:36 AM, spot 22931.2). I use it as a teaching example of how to read a call wall. It is a record of one moment, not a forecast.
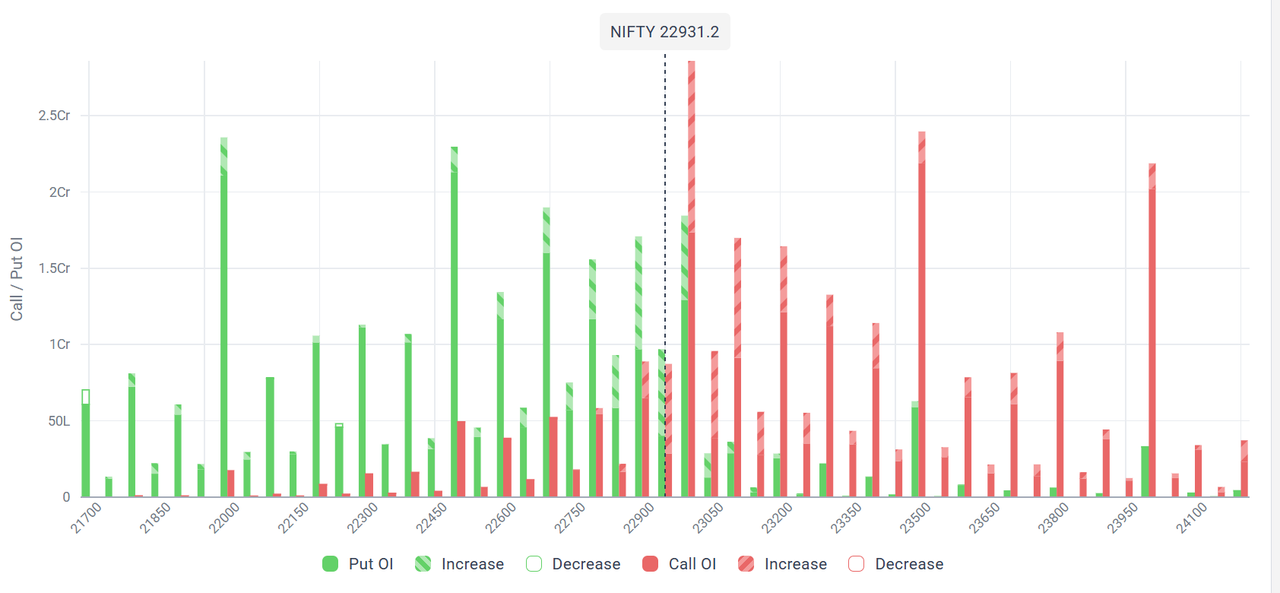
Follow the dotted line marked NIFTY 22931.2 and look to its right. The tallest red bar on the graph sits at 23000. Its top is hatched. That tells us two things. The call OI at 23000 was the largest on the chart, roughly 2.5 crore contracts on my reading of the axis. And a large part of it had been added in the current session, so the wall was growing.
More call OI sat at 23100 and 23200, both with hatched tops, with bigger walls at 23500 and 24000. That is a ladder of sellers above price. Left of the spot line, put OI was strong at 22900 with a large hatched portion, and deeper put walls stood at 22700 to 22800, 22500 and 22000.
The reading rule is simple. The largest call bar above price is the nearest ceiling, and the largest put bar below price is the nearest floor. At that moment, 23000 was the ceiling and 22900 was the first floor. In the session itself, price rejected near 23000, and 23000 acted as resistance, exactly where the OI graph had marked it.
Open interest gives me a level. The CPR indicator tells me whether price respects it. CPR stands for Central Pivot Range. It is built from the previous day's high, low and close, so it is ready before the market opens. It has a Top Central (TC), a Pivot and a Bottom Central (BC).
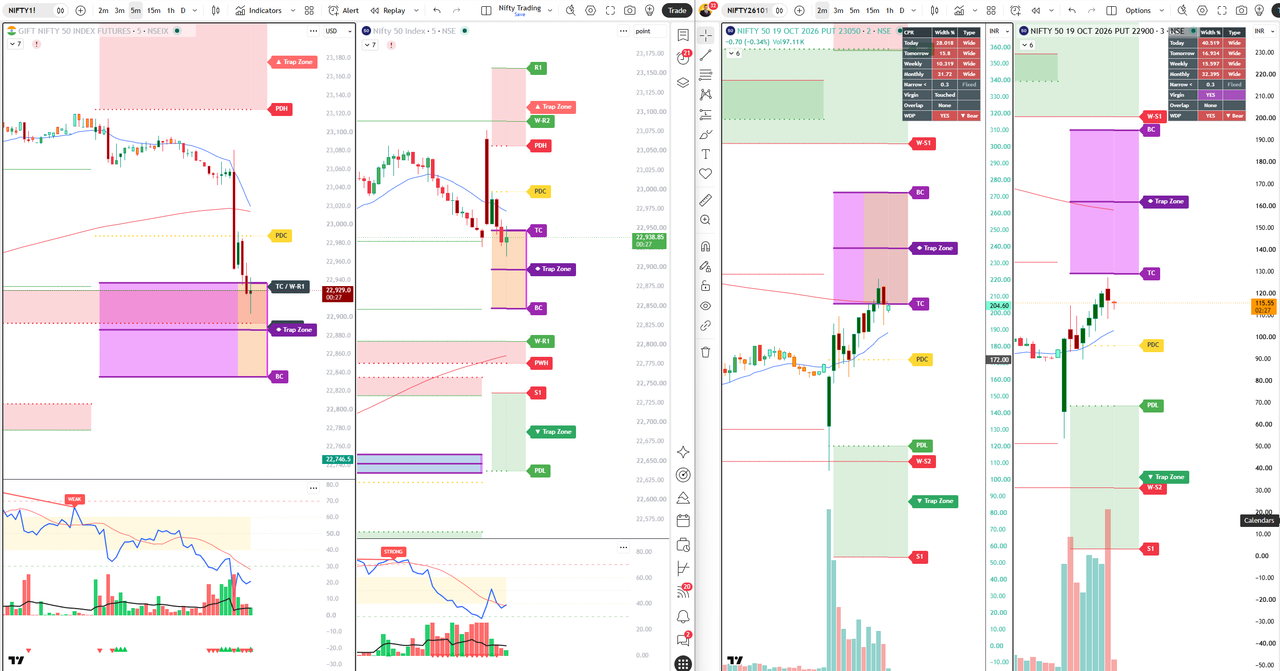
In the example, the previous day close (PDC) on the index chart sat close to 23000, the same strike as the call wall. When two independent tools mark one price, I call it confluence, and the level gets more weight. Price then fell through that area with a long red Elephant Candle, a wide-range candle that shows strong participation, and it paused around the TC of the CPR.
On the Gift Nifty chart I check where the futures trade relative to the TC, the BC and the weekly pivots. If Gift Nifty opens below the CPR, the opening bias is weak. If it opens above, bias is firm. This takes two minutes before the Opening Trade window of 9:15 to 9:45.
The option charts in the screenshot also show CPR tables with width percentage, virgin status and a bullish or bearish tag. Option premiums react faster than the index, so these tables help an Option Buyer time an entry.
OI rising does not say whether the market is bullish or bearish. You must read it with price. This simple matrix is one of the first things I teach.
| Price | Open Interest | Name | Reading |
|---|---|---|---|
| Up | Up | Long build-up | Fresh buying, trend has support |
| Down | Up | Short build-up | Fresh selling, pressure on price |
| Up | Down | Short covering | Sellers exiting, move may be short-lived |
| Down | Down | Long unwinding | Buyers exiting, weak support |
Apply the same idea at strike level. If price rises into 23000 and call OI there keeps rising, sellers are meeting the rally. If price rises into 23000 and call OI starts falling, sellers are leaving and the wall is weakening.
Open the Gift Nifty chart. Mark the previous day high, low and close, and the CPR levels. Then open the Open Interest Change graph and mark the largest call bar above price and the largest put bar below price.
I do not chase in the first minutes. I watch whether price moves towards a wall and what the OI bar does. If the wall keeps growing as price touches it, I prepare a setup.
I need one trigger candle at the level, such as a rejection wick or a close back below the wall on the five-minute chart. No trigger, no trade.
The stop goes beyond the wall, because a close through a growing call wall means my idea is wrong. The target goes to the next level, such as the CPR or the put wall.
Suppose price rallies into a call wall at 23000 and shows a rejection candle. I short Nifty futures at 22990. My stop is 23030, which is 40 points of risk. My first target is 22890, which is 100 points of reward. The Reward to Risk Ratio is 100 divided by 40, which is 2.5. My minimum is 2.
Now position size. With Rs 5,00,000 capital and a 1 percent risk rule, I can lose Rs 5,000 on a trade. For simple math, take an illustrative lot size of 100 (always check the current NSE lot size, since it changes). Risk per lot is 40 points times 100, which is Rs 4,000. So I take one lot. Two lots would risk Rs 8,000 and break my rule.
An Option Buyer pays premium, has limited loss and needs a quick move. In the same setup, buying a put at Rs 115 with a stop at Rs 85 and a target at Rs 175 risks 30 and aims for 60, which is also 1:2. Time decay works against the buyer, so timing matters.
An Option Seller collects premium and gains from time decay if price stays below the wall. Selling the call at the wall with a hard stop above it follows the OI logic. The seller wins often but can lose big without a stop, so I teach students to hedge with a far strike. Choose the side that fits your capital and temperament.
Every wall can break. These are the signs I look for, stated as rules and not as forecasts.
| Signal | Wall is respected | Wall is breaking |
|---|---|---|
| Call OI at the wall | Hatched red, still rising | Hollow red, falling |
| Put OI at and above the wall | Small or falling | Hatched green, rising as support moves up |
| Price vs CPR | Below TC, weak bounces | Above TC with a close over PDC |
| Candle behaviour | Rejection wicks, red Elephant Candle | Green Elephant Candle with volume |
| Option Buyer response | Puts on rejection | Calls only after a close above the wall |
| Option Seller response | Sell the wall with a stop beyond it | Close short calls, reassess |
If your stop is hit, accept it. The stop is the price of being wrong, and it is already included in the risk math.
Many traders sell well below the wall because they know it is resistance. Price drifts up and hits their stop. Fix: wait for the trigger at the wall.
A wall can be removed within minutes if writers cover. Fix: watch whether the bar turns hollow. If call OI falls and price closes above the wall, exit.
Students tell me they widened the stop because OI was still high. That doubles the loss. Fix: decide the stop before entry and never widen it.
Between a put floor and a call ceiling the range may be small. Five trades inside it mean five brokerages and five chances to be wrong. Fix: one clean setup per side, then stop.
OI alone, CPR alone or candles alone give weak signals. Fix: ask for at least three agreeing signals before risking money.
The NSE option chain is the primary source for Nifty 50 OI data. Platforms such as Sensibull and many broker apps show the same data as a chart, and the figures refresh during market hours.
It is the process of reading open interest and its change at each strike to find support, resistance and the direction of fresh positions. Always confirm it with price action.
Yes. The hatched and hollow bars mean the same thing. Sensex option data comes from BSE and uses its own strikes, so keep it separate from Nifty levels.
It is a useful indicator of where positions are concentrated, but it does not predict price on its own. Combine it with CPR levels, candles and a fixed stop loss.
Call writers lose money if price rises above their strike, so they defend it by hedging or adding supply near it. A very large and growing call OI at a strike therefore tends to slow rallies there.
Hatched means open interest increased. Hollow means it decreased. Red is call and green is put.
Pick the strike with the largest call OI above price for resistance and the largest put OI below price for support. Growing bars are stronger than shrinking bars.
A virgin CPR is a central pivot range that price has not traded through since it formed. Traders treat the first touch as a fresh reaction level.
Calculate TC, pivot and BC from the previous day high, low and close. Then check whether the biggest OI strikes sit near those levels. Overlap makes the level stronger.
Yes. It happens when call writers cover and the bar turns hollow, or when strong buying pushes price through. Wait for a close above the wall and falling call OI before you treat it as broken.
Volume counts all trades in a period. OI counts contracts that remain open. Volume shows activity and OI shows commitment.
No. Use it with price action, CPR levels and strict risk management. OI shows where positions are concentrated, not what price must do.
I teach this method step by step, with live charts. Explore the CPR Brahmastra Strategy course, browse all courses, read my books, see student testimonials, or visit the blog index for more setups.
Disclaimer: This article is for educational purposes only and is not investment advice. I am not a SEBI registered research analyst or investment adviser unless stated. Chart snapshots are historical examples, levels are read approximately from screenshots, and nothing here predicts future prices. Trading in futures and options involves risk of loss. Consult a registered adviser and use your own stop loss.
#TradingDirection #OpenInterest #NiftyOI #CPRStrategy #IntradayTrading