Quick answer
Premium CPR means plotting the Central Pivot Range on the option contract's own chart (the call or put), not on the spot index. If the premium trades above its CPR, buyers are in control and it is a good zone for buying. If it trades below its CPR, sellers are in control and it is a good zone for selling. Inside the CPR, wait.
What CPR is and the logic behind it
CPR stands for Central Pivot Range. It is a band drawn from the previous period's high, low and close. You already know the three formulas, so this section focuses on why they work, because understanding the logic is what lets you use CPR on any chart.
What the band tells you. A narrow band means the close was near the middle of the range, so the market was balanced and a sharp move out of it often follows. A wide band means the close was far from the midpoint, so price is already stretched and the next session tends to be choppier.
Why the extra lines matter. R1 to R3 and S1 to S3 are projections of the previous range above and below the pivot, which act as likely stopping points. PDH, PDL and PDC (previous day high, low and close) are the levels the market itself remembers, which is why price often reacts to them.
Why spot CPR is not enough for option traders
When you buy or sell an option, your profit depends on three things: the direction of the index, the speed of the move, and time decay. Spot CPR only describes the first one.
The premium chart shows what you actually hold. It reveals:
- Where the premium itself finds support or resistance, in rupees of premium and not index points.
- Whether the premium holds up even when the index looks calm, which is a hidden strength signal.
- Where buyers got trapped, so you can avoid the same zone.
- Realistic targets and stop-losses for your actual position.
The logic is simple: two options on the same index can behave very differently around the same level, because delta, volatility and decay differ by strike. The premium's own CPR already contains all of that.
How to apply CPR on a call or put option chart
- Open the option contract chart, not the index. For example, Nifty Call 22350 and Nifty Put 22400.
- Apply your CPR indicator on that contract. It will calculate the central band, support, resistance and previous-day levels from the option's own data.
- Use a lower timeframe. The 5-minute chart works well for entries, and the 15-minute chart works well for the bigger picture.
- Put the call and put side by side. When one premium is strong and the other is weak, the market is telling you the same story twice.
- Add a short moving average and RSI for confirmation. Do not trade CPR alone.
The core rule: above CPR buy, below CPR sell
This is the one idea to remember. It works on the option's own premium chart:
The logic: the CPR is the zone of fair value for that premium. Trading above it means buyers are willing to pay more than the previous fair price. Trading below it means they are not. A premium below its CPR is also one that is losing value, and for an option that is losing value, time decay is working in the seller's favour.
Real chart example: call and put side by side
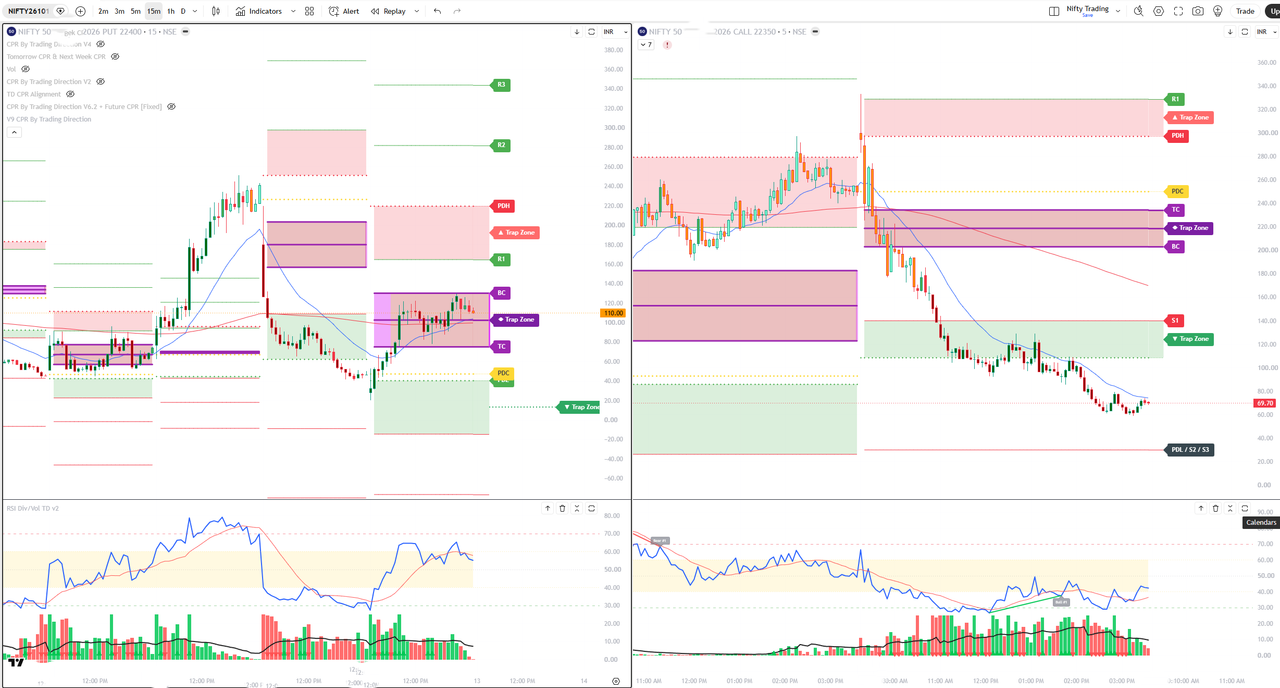
All values below are approximate, read from the chart.
The call option (22350 CE, 5-minute)
- The premium spiked into the R1 and PDH zone near the open and was rejected straight away. That red zone was supply, and buyers who chased the spike got trapped.
- It then fell through the TC and BC band and never came back above it.
- The next stop was the S1 zone. The premium bounced a little there but kept making lower highs.
- At the time of the screenshot the premium is near 70, below its short moving average and far below the CPR. RSI is weak and recovering slowly.
The put option (22400 PE, 15-minute)
- The put premium trades near 110, inside the CPR zone, after bouncing from support near PDC.
- It holds above its short moving average and RSI sits in the middle zone. There is strength, but not a clean breakout yet.
- Overhead, the PDH and R1 area is the supply zone to watch.
Putting both charts together
The call is trending down below its CPR while the put is holding near its own. That combination leans bearish for the index. The put chart tells you where to look for an entry, and the call chart confirms the story.
A simple rule set for premium CPR
- Buy only above TC. If the premium holds above the top of its own CPR, you are buying strength.
- Sell only below BC. If the premium holds below the bottom of its own CPR, you are selling weakness.
- Avoid the band. Between BC and TC, stay out.
- Respect trap zones. If the premium is rejected from R1 or PDH, do not chase it.
- Use CPR levels as targets. A buy above TC can target R1 first, then R2.
- Place stops on the other side of the CPR. Buyers use a stop below BC, sellers use a stop above TC.
- Confirm with the pair. Trade the side where one premium is above CPR and the opposite premium is below.
Common mistakes to avoid
- Using spot CPR levels on an option chart. The numbers are different. Always use the contract's own CPR.
- Buying every dip on a falling premium. Time decay works against buyers.
- Selling without a stop. Option selling can lose far more than the premium collected.
- Treating expiry day like a normal day. Premiums move fast, so use smaller size.
- Ignoring CPR width. A wide CPR on the premium chart often means a choppy session.
Frequently asked questions
Does CPR work on option charts?
Yes. CPR is built from high, low and close, so it can be applied to any chart, including a call or put option premium chart. Use the option contract's own CPR, not the spot index CPR.
When is an option premium good for buying using CPR?
When the premium trades above its own CPR and holds there. Buyers are in control, so it is the better zone for buying that option.
When is an option premium good for selling using CPR?
When the premium trades below its own CPR. Sellers are in control and time decay works in the seller's favour.
Which timeframe is best for premium CPR?
Most traders use the 5-minute chart for entries and the 15-minute chart to understand the larger structure.
Is premium CPR suitable for beginners?
The levels are simple, so it is beginner friendly. Beginners should still paper trade first and keep position size small, especially when selling options.
Final thoughts
Spot CPR tells you about the market. Premium CPR tells you about your trade. Remember one line: above CPR is good for buying, below CPR is good for selling, inside CPR is a wait. Open the call and put charts side by side on your next session and watch how each premium behaves around its own CPR. If you want to learn this step by step with live guidance, see the Pro Traders Mentorship Program.
Learn more: course and book on option trading
Pro Traders Mentorship Program
Want to apply CPR, trap zones and premium levels with guidance from Trading Direction? Join the mentorship program and learn a complete, rule-based approach.
Explore the courseRecommended book on option trading
Build a strong base in how options work, from premium and decay to risk management, before you start buying or selling.
View the book on AmazonDisclaimer: This article is for educational purposes only and is not investment advice. Options trading, and especially option selling, involves a high risk of loss. Please consult a SEBI-registered advisor before trading.