Free Narrow CPR Stock Scanner: Daily Shortlist for Breakout Trades
Narrow CPR · Stock Scanner
There are no items in your cart
Add More
Add More
| Item Details | Price | ||
|---|---|---|---|
A price action trading strategy analyzes raw price movements on a clean chart using market structure (higher highs/higher lows or lower highs/lower lows), support and resistance zones, and candlestick patterns. By removing lagging indicators, traders evaluate real-time supply and demand to identify high-probability entries, precise stop-losses, and realistic targets in index and stock trading.
Price Action Trading is a discipline where trading decisions are made purely from historical and current price quotes, candlestick formations, and structural market levels without relying on secondary mathematical indicators like RSI, MACD, or Moving Averages.
Many beginner traders load their charts with 4 to 5 technical indicators—RSI, Moving Averages, MACD, and Stochastic oscillators—only to find themselves completely paralyzed when signals conflict. During my 9+ years in the Indian markets, I have learned that indicators are merely derivative calculations of price and volume; they show what price did in the past, not what big institutional players are doing right now.
Price action cuts through the noise. By focusing on raw candlestick behavior at key institutional levels, price action trading gives you three distinct edges:
A successful price action trade requires three independent factors to line up. Taking a trade based on a candlestick pattern alone—without context—is a recipe for drawdowns.
| Pillar | Core Question Asked | Tools / Logic Used |
|---|---|---|
| 1. Market Structure | Where is the overall market moving? | Higher Highs/Higher Lows (Uptrend), Lower Highs/Lower Lows (Downtrend), Horizontal Range (Sideways) |
| 2. Key Location | Where is the price reacting right now? | Support & Resistance zones, Prior Day High/Low, Central Pivot Range (CPR) |
| 3. Trigger Pattern | Who is winning the immediate battle? | Pinbar / Hammer, Engulfing Patterns, Inside Bars, Breakout Candles |
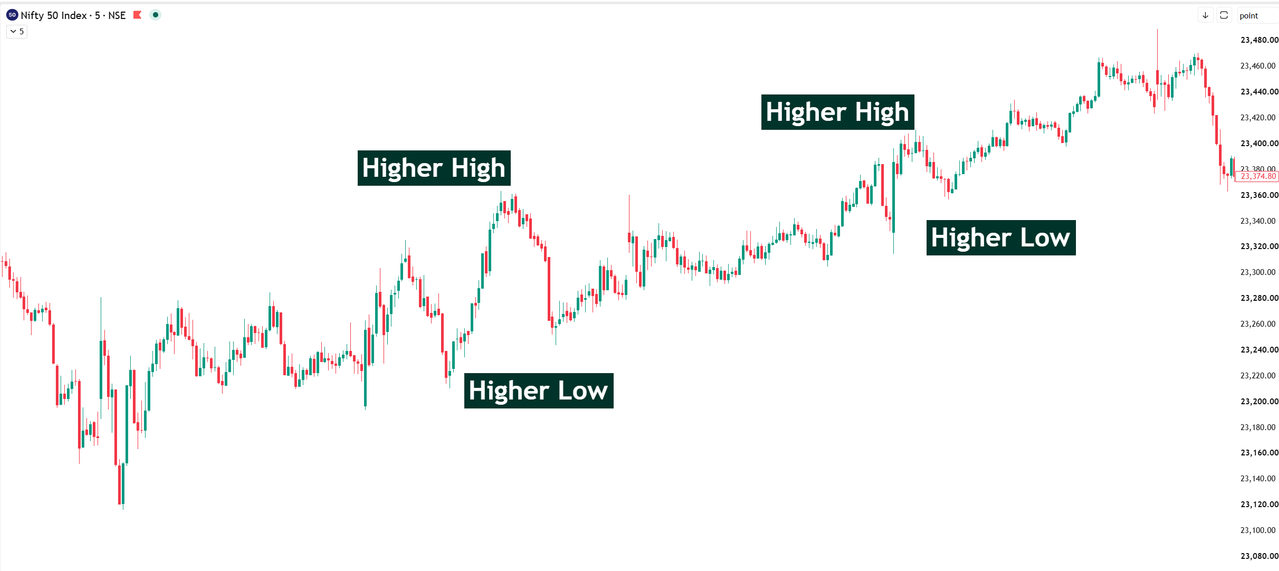
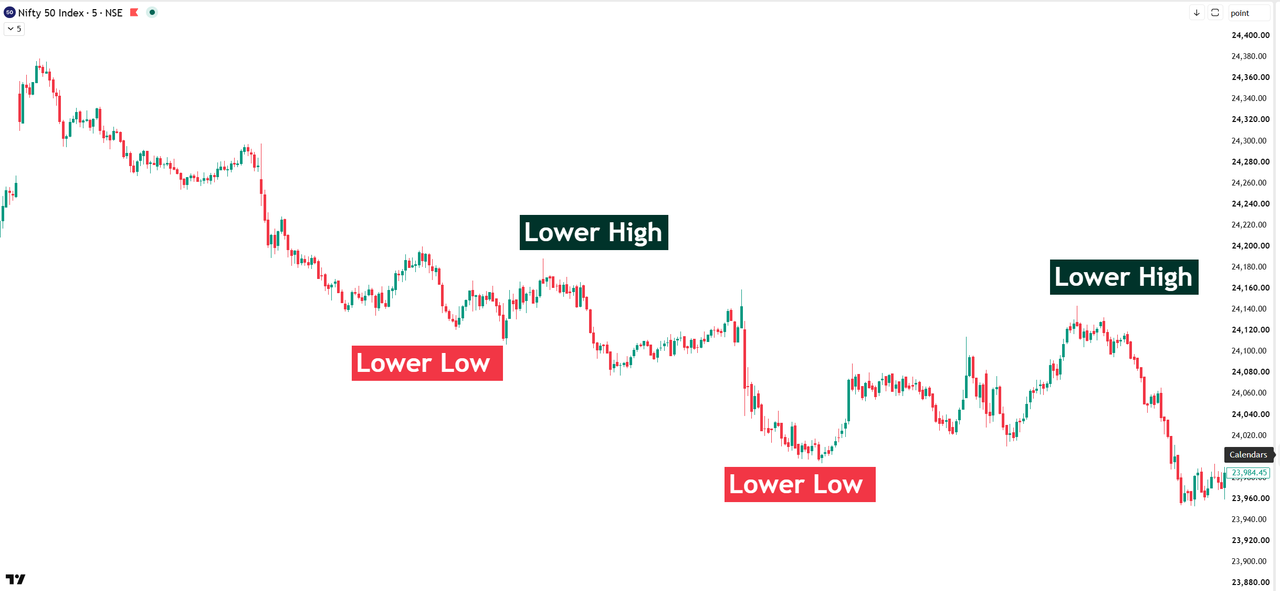
Market structure is the backbone of any reliable price action trading strategy. Before looking for buy or sell signals, determine the state of the market on your primary trading timeframe (e.g., 5-minute or 15-minute for intraday, Daily for swing trading).
An uptrend is characterized by a sequence of Higher Highs (HH) and Higher Lows (HL). In an uptrend, aggressive buyers step in before the price reaches the previous swing low. Your objective in an uptrend is to buy on pullbacks near Higher Lows.
A downtrend consists of Lower Highs (LH) and Lower Lows (LL). Sellers dominate every rally, preventing the price from exceeding previous swing highs. Your objective is to sell or short on rallies near Lower Highs.
When the market trades between a clear horizontal resistance ceiling and support floor without creating new structural highs or lows, it is in consolidation. Price action traders avoid trading in the middle of a range, opting instead to trade reversal setups at the boundaries or wait for a confirmed breakout.
Concept: Resistance becomes Support (or vice versa).
Chart Logic: When NIFTY breaks out of a key resistance zone with a strong bullish candle, do not chase the breakout candle immediately. Wait for price to pull back and retest the broken resistance level (now acting as new support). Look for a bullish rejection candle (Hammer or Bullish Engulfing) to confirm the pullback holds.
Numbers are for illustration only, to show how the entry, stop-loss, and target are structured around the retest candle — not a live recommendation.
Concept: Institutional liquidity gathering near obvious high/low levels.
Chart Logic: Price breaks past a well-known resistance level, luring retail buyers into long positions. However, the candle immediately closes back below the breakout level, forming a long upper wick (Pinbar). This signals that smart money dumped supply into retail demand.
Numbers are for illustration only, to show how the trap candle defines entry and stop-loss — not a live recommendation.
While price action works on clean charts, adding static pivot levels like the **Central Pivot Range (CPR)** enhances precision without adding lag. CPR provides objective horizontal levels calculated from the previous session's price data.
When raw price action aligns with CPR levels, setup probability increases significantly:
"Smart Money Concepts" has become one of the most searched trading terms in 2026, and traders often ask whether it's different from classic price action. The honest answer: SMC is price action, rebranded and relabeled around institutional order-flow vocabulary.
| Classic Price Action Term | Equivalent SMC Term | What It Really Means |
|---|---|---|
| Support / Resistance Zone | Order Block | A price area where large buy/sell orders were previously absorbed |
| Failed Breakout / Trap | Liquidity Grab / Sweep | Price pierces an obvious level to trigger stop-losses before reversing |
| Gap-Fill Zone | Fair Value Gap (FVG) | An imbalance candle range price tends to revisit |
| Breakout-Retest | Break of Structure (BOS) | Confirmation that the prevailing trend is continuing |
At Trading Direction, we teach the underlying skill — reading structure, location, and trigger — so that whichever vocabulary you encounter online, you already understand the mechanics behind it.
Even without lagging indicators, traders can fall into standard psychological traps. Avoid these frequent errors:
Run through these five rules before placing any intraday or swing trade:
For intraday trading in NIFTY and Bank NIFTY, the 5-minute chart is optimal for trade execution, while the 15-minute and 1-hour charts provide structural context. For swing trading, the Daily and Weekly timeframes are recommended.
Yes. Price action is well-suited for beginners because it forces you to focus on raw price, market structure, and risk management rather than relying on mathematical indicator signals.
Price action analyzes real-time price quotes, candlestick formations, and market structure directly from the chart. Technical indicators apply mathematical formulas to past price data, introducing a lag in decision-making.
A false breakout occurs when price moves beyond a key support or resistance level but fails to sustain momentum, quickly closing back inside the range—often forming a candle with a long wick pointing outside the breakout level.
Yes. Options buyers require quick directional momentum. Trading price action setups at key CPR and market structure levels helps options buyers capture sharp moves while minimizing time decay (Theta) exposure.
Not really — SMC largely renames classic price action ideas (support/resistance as "order blocks," false breakouts as "liquidity sweeps"). Traders who master structure, location, and trigger under either name are learning the same core skill.
Mastering price action isn't about memorizing dozens of candlestick names. It is about understanding market context: reading whether buyers or sellers control key levels, entering only when risk-reward is heavily in your favor, and strictly adhering to risk management rules on every trade.
Learn step-by-step price action patterns, CPR levels, and risk management directly from Anil Hanegave.
Join the CPR Brahmastra Program