Free Narrow CPR Stock Scanner: Daily Shortlist for Breakout Trades
Narrow CPR · Stock Scanner
There are no items in your cart
Add More
Add More
| Item Details | Price | ||
|---|---|---|---|
What to do when your Daily, Weekly and Monthly CPR agree — and what to do when they don't.
When the Monthly, Weekly and Daily CPR (MWDP) are aligned and nested in the same direction, price usually has room to trend, and CPR zones favor trend-following entries on breakouts and retests. When the three timeframes disagree — a "mismatch" — price typically gets trapped moving between the conflicting CPR bands until the higher timeframe finally forces a resolution, and that resolution is where the reversal trade shows up. Knowing which of these two states the market is in, before you place the trade, is the actual edge.
MWDP stands for Monthly, Weekly and Daily Pivot — read together as the Monthly, Weekly and Daily CPR (Central Pivot Range). MWDP alignment describes whether the CPR zones on these three timeframes are stacked and pointing in the same direction ("match") or sitting apart with conflicting bias and no clean overlap ("mismatch").
You pull up NIFTY on a Monday morning. The Daily CPR looks like a clean breakout — narrow, price pushing above R1, everything textbook. You take it. By 11 am, price is back inside the CPR and your stop is hit. Nothing was wrong with your entry rules. What was wrong is that you never checked whether the Weekly and Monthly CPR agreed with that Daily breakout in the first place. Almost every "the setup looked perfect but it failed anyway" story traces back to this one gap — trading a single timeframe's CPR as if it were the whole picture.
Every timeframe — Daily, Weekly, Monthly — builds its own CPR from the previous period's high, low and close. A narrow CPR on any timeframe usually points to a trending bias for that period; a wide CPR points to a sideways, indecisive one. MWDP simply asks: are these three CPRs telling the same story, or three different ones?
Match: the Daily CPR sits inside or clearly above/below the Weekly CPR, and the Weekly sits in the same relative position to the Monthly. Each smaller timeframe is nested neatly inside the direction the bigger timeframe has already committed to.
Mismatch: the timeframes disagree. Price is above the Daily CPR but still sitting inside a wide, undecided Weekly CPR. Or the futures (GIFT Nifty) CPR structure has already broken one way while the cash market's Weekly CPR hasn't confirmed it. Most CPR tools flag this directly — look for a "CPR Overlap" or "MTF Align" reading that says "No Overlap" (no shared ground between timeframes) instead of a clean alignment.
On a matched structure, you'll see the Daily CPR box sit cleanly inside the Weekly CPR box, which itself sits inside the Monthly CPR box — three nested rectangles all leaning the same way, with price making higher highs through each layer without falling back into the one below. On a mismatched structure, you'll see the opposite: boxes that don't overlap, a support zone on one timeframe sitting right where another timeframe shows resistance, and price chopping between the two instead of picking a direction.
This is the environment where breakout and retest strategies actually earn their keep. When Monthly, Weekly and Daily CPR are stacked in the same direction, each smaller timeframe is essentially trading with the tailwind of the bigger one instead of against it.
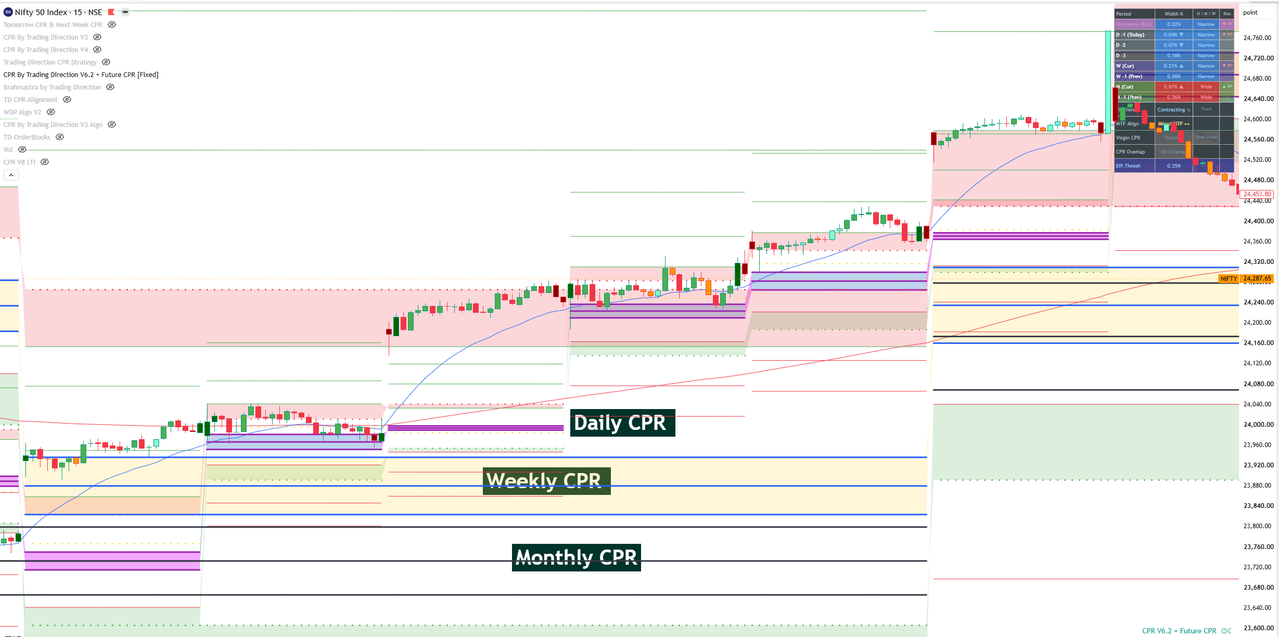
Chart logic: Look at how each daily session hands off to the next in that image. The first daily leg breaks above its CPR and holds. The next session's CPR forms higher, still inside the Weekly CPR's upper half. By the third and fourth session, price is trading well above even the Weekly CPR, and the Monthly CPR — the slowest, widest one — is only just starting to confirm the same direction. That lag is normal. The Monthly CPR is meant to confirm late; it's the anchor, not the trigger.
Example: this is the same behavior you see when NIFTY runs from the low-23,000s toward 24,500+ over a few weeks without a real multi-day pullback — each daily CPR is simply confirming what the weekly and monthly structure had already set up. The breakout candle isn't the story; the fact that three timeframes agreed before the candle printed is the story.
Mistake: reading only the Daily CPR and treating every breakout above it as tradeable, regardless of what the Weekly and Monthly columns say. A Daily breakout inside a wide, undecided Monthly CPR is a very different trade than the same breakout with a narrow, expanding Monthly CPR behind it — even though the daily candle looks identical.
Fix: before taking a CPR breakout, glance at the Width % and Bias columns across D / W (Cur) / M (Cur). If all three are narrowing or expanding in the same direction and the bias arrows agree, you're in a trend-following environment — the breakout deserves your normal position size and a trail-the-trend management style, not a scalp-and-run exit.
This is the setup most traders lose money on without realizing why. It doesn't look like chop on the surface — it looks like a breakout is "about to happen." It just never quite completes.
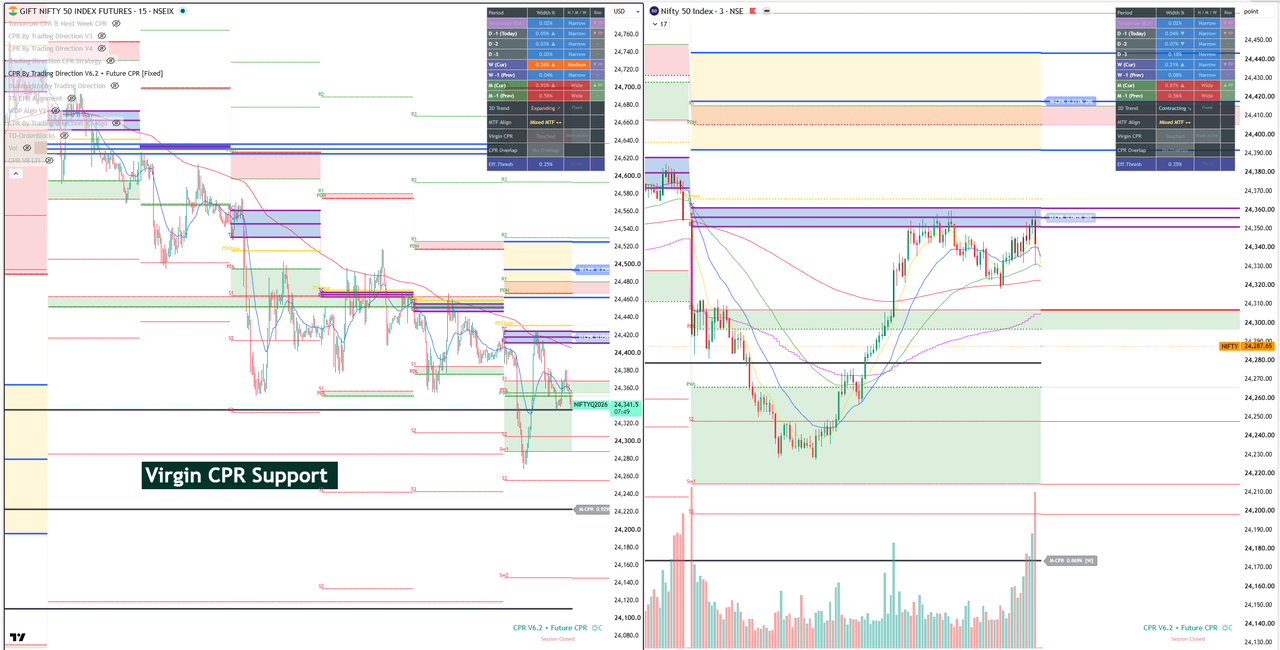
Chart logic: notice the "CPR Overlap: No Overlap" reading in that panel. That single line is doing a lot of work — it's telling you the futures structure and the cash structure aren't agreeing on where value sits right now. Price is boxed in between multiple resistance clusters (R1, R2, R3 stacked close together above) and a support zone marked as a Virgin CPR — a CPR level that hasn't been touched or tested yet on that timeframe. Untested levels tend to attract price rather than repel it, which is exactly why price keeps drifting down toward that zone instead of breaking cleanly through the resistance stack above.
Example: in the pre-market GIFT Nifty session, the Daily CPR can look narrow and directional while the Weekly CPR is still wide and undecided. Traders who only look at the futures screen take the "breakout," not realizing the cash market's higher timeframe structure hasn't confirmed anything. Price oscillates between the S1/PDL support and the R1/PDH resistance for the whole session — every breakout attempt in either direction fails and snaps back.
Mistake: chasing the first move out of this zone as if it were a clean breakout. A breakout is not automatically a trade — inside a mismatch, the first push through a level is more often a stop-hunt into the next conflicting timeframe's level than the start of a real trend.
Fix: when the Overlap column reads "No Overlap" or the D/W/M bias arrows are pointing in different directions, stop looking for breakout trades and start looking for reversal trades at the edges. Fade the move as price approaches R1/R2 with the Weekly or Monthly CPR still overhead, or look to buy the reaction off a Virgin CPR support with a tight stop below it — you're trading the boundaries of the range, not the middle of it.
Market mein har breakout trade nahi hota — not every breakout is a trade, and a mismatch is exactly where that shows up most. Here's where it gets interesting: a mismatch is not a permanent state. The Daily CPR resets every session; the Weekly resets once a week; the Monthly resets once a month. Because the Daily is the fastest-moving of the three, it's usually the Daily structure that eventually bends toward the Weekly and Monthly — not the other way round.
In practice this means: when price has been trapped between conflicting CPR zones for a few sessions, watch for the Daily CPR to finally form on the same side as the Weekly CPR. That's usually the tell that the "in-between" phase is ending, and it's also usually the point where the move that follows is sharper than a normal breakout — because it's unwinding several sessions of trapped positions on the wrong side, not just breaking one level.
| Aspect | Trend Following (MWDP Match) | Reversal Trading (MWDP Mismatch) |
|---|---|---|
| CPR structure | Daily nested inside Weekly, Weekly inside Monthly | Overlap reads "No Overlap"; D/W/M bias disagree |
| Best entry style | Breakout + retest, in the direction of all three | Fade at the range edges (near R1/R2 or Virgin CPR support) |
| Where price tends to close | Away from the CPR, extending the move | Back inside the range, between the two conflicting zones |
| Position management | Trail the trade, let it run with the higher timeframe | Book quicker, since the range can snap either way |
| Common trap | Ignoring the Monthly CPR because it "confirms too late" | Chasing the first breakout attempt out of the range |
The setup tells you when a trade may be worth considering. Risk management tells you how much that idea is allowed to cost you — that doesn't change just because the setup type does.
One mistake I see repeatedly with new traders is that they check only the timeframe their strategy is built on — usually Daily — and never glance at the Weekly and Monthly columns sitting right next to it in the same panel. The data is already there; it's just being ignored.
A second common pattern is treating "No Overlap" as noise instead of information. That single reading is one of the most useful filters CPR-based tools give you — it's telling you, in plain terms, not to trust a breakout right now.
The third is position sizing the same way for both setups. A trend-following trade with all three timeframes aligned can justify normal size and a wider trail. A reversal trade inside a mismatch is, by definition, happening in an environment with less agreement — size it smaller and take profit sooner.
MWDP refers to reading the Monthly, Weekly and Daily Pivot (CPR) together instead of in isolation. It's a way of checking whether three different timeframes agree on market direction before taking a trade based on any single one of them.
Look at where each timeframe's CPR sits relative to the others and to current price. If the Daily CPR is nested inside the Weekly CPR, and the Weekly is nested inside the Monthly, in the same direction, that's a match. Most CPR indicators also show a direct "CPR Overlap" or "MTF Align" reading that states this for you.
You can, but the odds are weaker. A breakout during a mismatch is more likely to fail and snap back, since the higher timeframe hasn't confirmed the move. It's generally safer to trade the edges of the range instead of chasing the breakout itself.
A Virgin CPR is a CPR level on a higher timeframe that price hasn't touched or tested yet. Untested levels often act as a magnet, pulling price toward them, which makes them useful reference points for where a reversal trade inside a mismatch is more likely to react.
They overlap but aren't identical. A range-bound market is a price observation; a CPR mismatch is a structural reason one is happening — the timeframes disagreeing is often exactly why price can't commit to a direction.
Neither alone. The Daily CPR reacts fastest and is useful for timing, but the Weekly and Monthly CPR carry more weight for direction because they represent a longer consensus. When they disagree, it's usually the Daily that eventually bends toward the higher timeframe, not the reverse.
Before you take a CPR-based trade, spend ten seconds checking all three timeframes, not just the one your setup is built around. If Monthly, Weekly and Daily CPR are nested and pointing the same way, you're in trend-following conditions — trade the breakout and let it run with the higher timeframe. If they're not agreeing, you're in a mismatch — trade the edges of the range with tighter risk, and wait for the Daily CPR to finally align with the Weekly before you start chasing breakouts again. The read doesn't change from trade to trade; the market's willingness to confirm it does.
If you want a structured way to read CPR across timeframes before every trade, this is exactly what we cover, level by level, inside the CPR Brahmastra program.
Explore the CPR Brahmastra WebinarFor more setups like this, browse the Trading Direction blog, check what other traders say on the testimonials page, or see the full course catalog in the store.