Free Narrow CPR Stock Scanner: Daily Shortlist for Breakout Trades
Narrow CPR · Stock Scanner
There are no items in your cart
Add More
Add More
| Item Details | Price | ||
|---|---|---|---|
Learn how the Central Pivot Range (CPR) indicator is calculated and used for intraday trading — covering Virgin CPR, Narrow CPR, Pivot Point Breakouts, and Trap Zones — with the Trading Direction methodology of combining CPR, Price Action, and Heikin Ashi Volume EMA.
CPR (Central Pivot Range) is a standard pivot point-based support-resistance indicator calculated from the previous day's or week's High, Low, and Close. It consists of three lines — Pivot (P), Top Central (TC), and Bottom Central (BC) — which form a key support-resistance zone for the next trading session. When price trades above TC, the market bias is bullish; below BC, the bias is bearish. At Trading Direction, CPR is combined with VWAP, 20 EMA, and Price Action to build probability intraday setups.
CPR (Central Pivot Range) is a pivot point based Leading indicator that maps out predefined support and resistance zones before a trading day or week even begins. It is calculated purely from Price action, the previous session's High, Low, and Close — no lagging moving averages involved.
Traders use CPR to understand:
In the Trading Direction methodology, CPR is never used alone — it is combined with Price Action and Heikin Ashi Volume EMA to build confluence and reduce false signals. Explore the full framework in the Trading Direction Course Store.
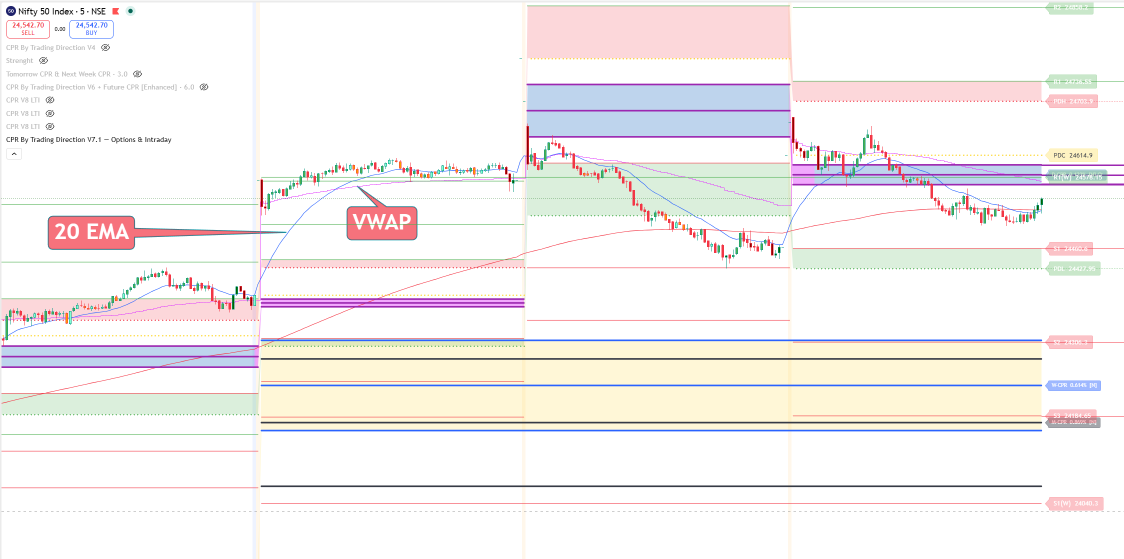
Nifty 50 · 5-min chart — CPR By Trading Direction indicator with VWAP and 20 EMA confluence
CPR is built from three simple formulas using the previous session's High (H), Low (L), and Close (C):
| Component | Formula |
|---|---|
| Pivot (P) | (High + Low + Close) / 3 |
| Bottom Central (BC) | (High + Low) / 2 |
| Top Central (TC) | (Pivot − BC) + Pivot |
I use this for Multi time frame Analysis, for Daily, Weekly, and Monthly timeframes. The CPR By Trading Direction V8 indicator plots Daily, Weekly (W-CPR), and Monthly (M-CPR) levels together for multi-timeframe confluence.
Step-by-step example:
If today's price opens or trades above 24,598 (TC), the bias is considered bullish.
CPR is not limited to just three lines. The full CPR system includes:
When CPR, VWAP, and previous day levels align in the same price zone, it is called a "confluence zone" — these zones offer the highest probability trade setups.
Virgin CPR is a CPR range that price has not yet touched — meaning price hasn't entered that CPR zone during the current session.
Why Virgin CPR matters:
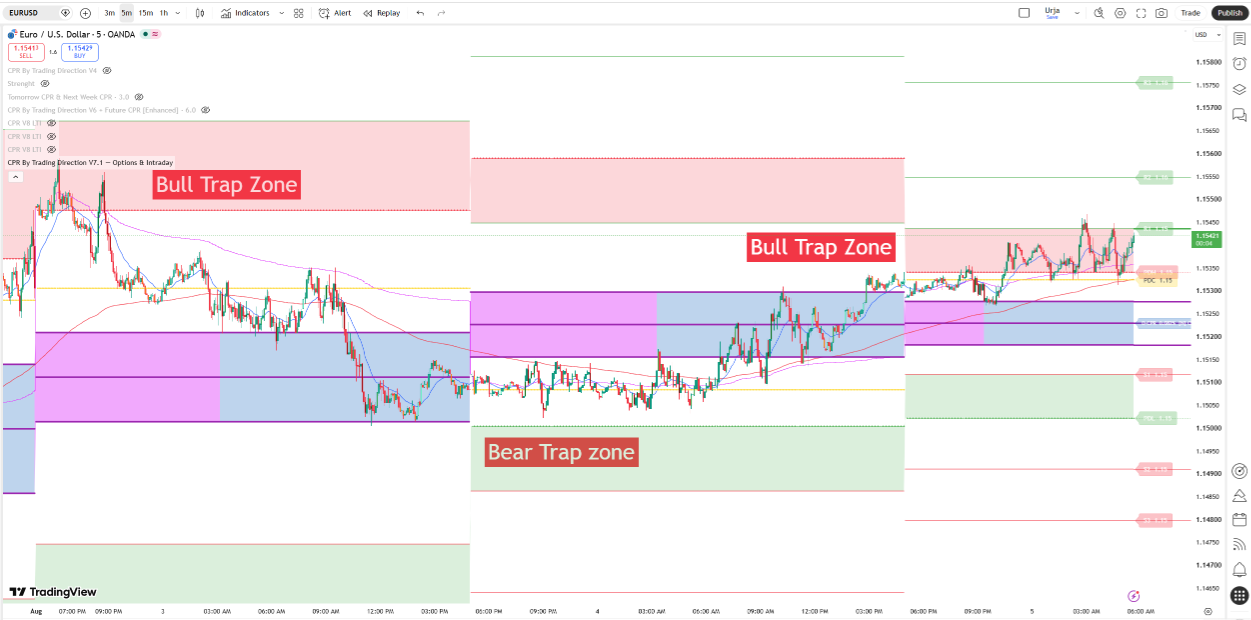
EURUSD · 1H chart — Virgin CPR zone where price enters for the first time
Trading help: Wait for a confirmation candle before taking a position near Virgin CPR — the first touch can also give a fake breakout.
When the gap between TC and BC becomes very small (typically the CPR width is well below the average of previous days), it is called a Narrow CPR. In Nifty 50 if it is less than 14 points then it is Narrow CPR.
What Narrow CPR signals:
The Trading Direction Narrow CPR Scanner automatically identifies this setup — helping traders know early in the morning whether today could be a "trend day."
In CPR by Trading Direction V6, I use adaptive CPR, Adaptive vs Fixed Threshold: Instead of using just a fixed % threshold, an adaptive threshold (which adjusts based on recent volatility) gives more reliable confirmation — especially for high-volatility indices like Nifty.
A CPR Breakout happens when price closes or sustains strongly outside the CPR range (TC-BC), confirming that a bias has been set in one direction.
Bullish CPR Breakout:
Bearish CPR Breakdown:
Important: Simply touching or crossing CPR is not a breakout or breakdown — candle close and volume confirmation are essential, otherwise you risk getting caught in a fake breakout (see Trap Zones below).
Trap Zones are areas where retail traders enter in the wrong direction, and smart money then pushes price in the opposite direction, "trapping" them.
Bull Trap Zone
Price appears to break resistance (near R1 and PDH), breakout traders go long — but price then rejects and falls back. This zone typically forms around CPR's upper resistance bands (R1-R2).
Bear Trap Zone
Price appears to break support (near S1 and PDL), breakdown traders go short — but price reverses and moves back up. This zone forms around CPR's lower support bands (S1-S2).
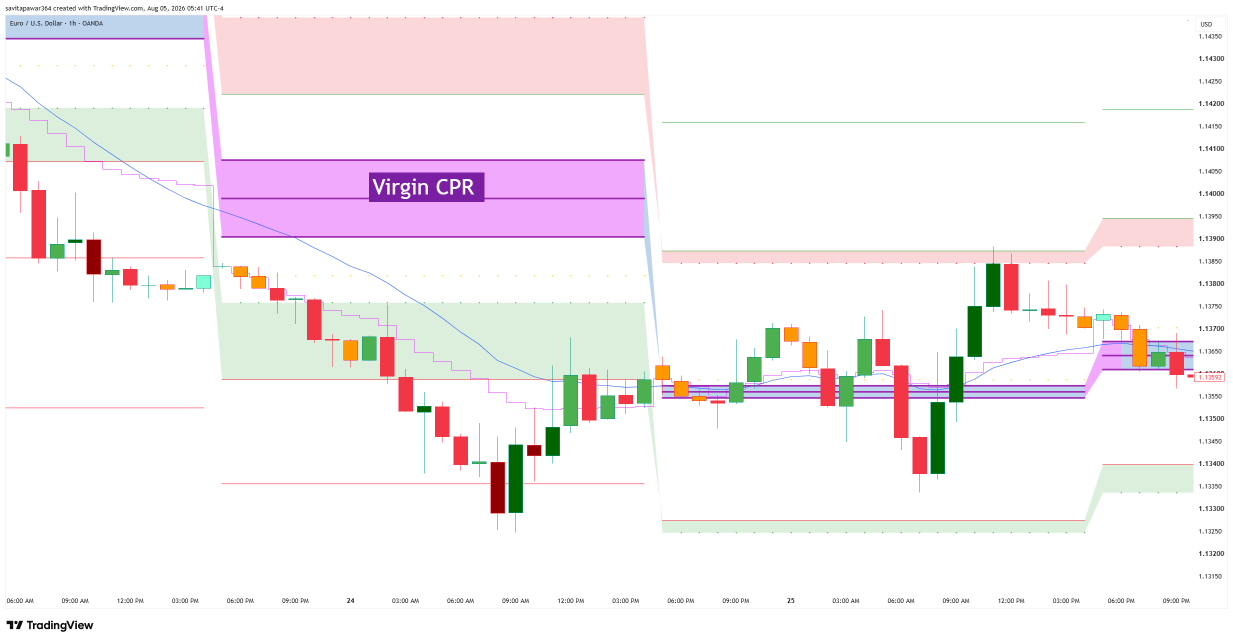
EURUSD · 5-min chart — CPR By Trading Direction V7.1 (Options & Intraday) indicator marking Bull Trap and Bear Trap zones
How to avoid traps: Wait for a confirmation candle, a volume spike, and a VWAP/20 EMA reclaim before entering near trap zones. Never take an entry just because price touched one CPR level.
1. CPR + Price Action Reversal Strategy
2. Narrow CPR Trend Day Strategy
3. Virgin CPR Breakout Strategy
4. Trap Zone Fade Strategy
Learn these strategies step-by-step in the CPR Brahmastra Strategy course.
| Mistake | Correct Approach |
|---|---|
| Entering as soon as price touches CPR | Wait for candle close + volume or strength confirmation, 5 min, for Day trading. |
| Using CPR in isolation | Combine with VWAP, 20 EMA, and Price Action |
| Applying the same strategy every day | Check Narrow vs Wide CPR first, then decide the strategy |
| Ignoring trap zones | Exercise extra caution near resistance/support |
| Not placing a stop-loss | Always fix SL on the opposite boundary of CPR |
Q1. Is CPR best for intraday trading or positional trading?
Standard CPR is primarily used for intraday and swing trading. Daily CPR is used for intraday, while Weekly and Monthly CPR give broader trend context. Use CPR by Trading Direction V3 for Best Results.
Q2. What does Narrow CPR mean?
Narrow CPR means the gap between TC and BC is very small — signaling that today could be a trending/volatile day. Low Width.
Q3. How long does a Virgin CPR stay valid?
3 to 4 days, it remains Virgin — it can get touched within the same session or stay untouched for several sessions.
Q4. How do I confirm a CPR breakout?
The candle should close outside the CPR boundary, strength should support it, and VWAP/20 EMA should be in the same direction — only then treat the breakout as valid. WDP Should Match.
Q5. How do I identify Bull Trap and Bear Trap zones?
These zones typically form around CPR's R1-PDH (Bull Trap) and S1-PDL (Bear Trap) resistance/support bands, where false breakouts occur frequently.
"CPR combined with Price Action and Heikin Ashi Volume EMA is the foundation of every setup we teach." — Anil Hanegave
Over 15,000+ students have learned this CPR + Price Action + Heikin Ashi methodology through the CPR Brahmastra Strategy, Intraday Trading Mastery, and Pro Traders Mentorship Program at Trading Direction. Explore all courses and indicators in the Trading Direction Store, or grab the book on leading indicators from the Book Page.
Disclaimer: This article is for educational purposes only. Trading involves risk — please do your own research or consult a certified advisor before taking trades.

Anil Hanegave, Amazon Bestselling Author
Founder, Trading Direction — CPR, Price Action & Heikin Ashi trading education for 21,000+ students across India.