Free Narrow CPR Stock Scanner: Daily Shortlist for Breakout Trades
Narrow CPR · Stock Scanner
There are no items in your cart
Add More
Add More
| Item Details | Price | ||
|---|---|---|---|
Direction is the single most important concept in trading — it's the difference between trading with the market's flow and fighting against it. This guide breaks down exactly what direction means, how professional traders read it, and how you can use it to trade with more confidence.
10-August-2026
Direction in trading is the overall path a price is moving — up (bullish/uptrend), down (bearish/downtrend), or sideways (range-bound). It's identified through swing highs/lows, moving averages, trendlines, and higher-timeframe confirmation. Trading in the same direction as the dominant trend generally offers a higher probability of success than trading against it.
In this article: What direction means · How to identify it · Direction vs. momentum · Trend-following vs. counter-trend trading · Common mistakes · FAQs
"The trend is your friend — until it ends." — Old trading proverb
In trading, direction refers to the path a price is moving on a chart: up, down, or sideways. It sounds simple, but almost every trading decision — when to buy, when to sell, when to stay out — ultimately comes down to your read on direction. Traders who consistently make money aren't necessarily the ones with the "best" entries; they're the ones who correctly identify direction and trade with it rather than against it.
There are three basic directions a market can move in: an uptrend (bullish direction), where price makes higher highs and higher lows; a downtrend (bearish direction), where price makes lower highs and lower lows; and a sideways or range-bound market, where price oscillates between support and resistance without a sustained move either way.
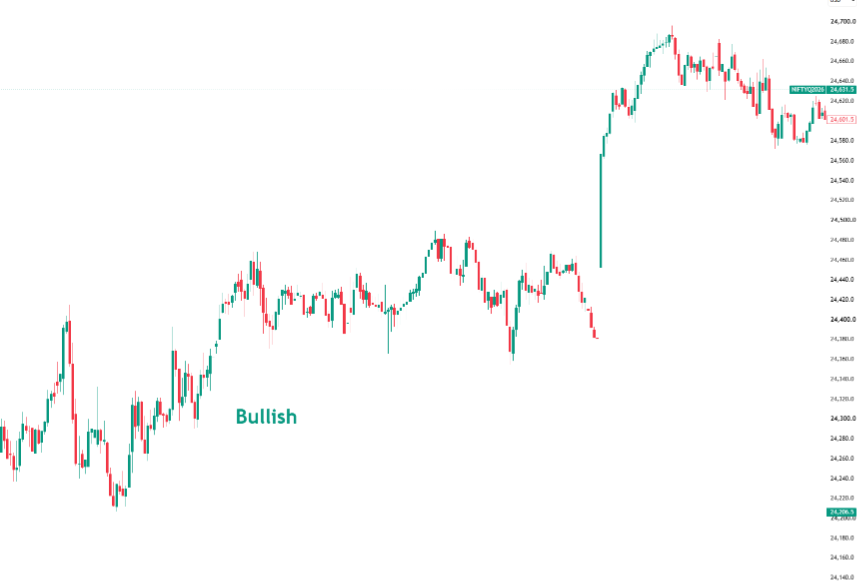
Example of bullish direction: price making a clear series of higher highs, confirming an uptrend.
| Direction | Price Structure | Typical Trader Bias | Common Signal |
|---|---|---|---|
| Uptrend (Bullish) | Higher highs, higher lows | Buy dips | Price above rising moving average |
| Downtrend (Bearish) | Lower highs, lower lows | Sell rallies | Price below falling moving average |
| Sideways (Range-bound) | Repeated bounces between support/resistance | Buy support, sell resistance | Flat moving average, no clear swing progression |
New traders often obsess over finding the "perfect entry" — the exact candle, the exact price, the exact indicator signal. But even a great entry on the wrong side of the market's direction usually ends in a loss. If the overall direction is up, buying on minor dips tends to work in your favor over time. If the direction is down, the same buying strategy will bleed you dry, no matter how precise your entry timing is.
This is why experienced traders repeat the phrase "the trend is your friend" — because direction, not timing, drives the majority of trading outcomes. Once you can reliably read direction, position sizing and entry refinement become far more effective tools. Risk management also improves: stop-losses placed in the direction of the trend tend to get tested less often than stops placed against it.
There's no single indicator that reveals direction with 100% accuracy, but combining a few tools gives a reliable read:
1. Price action and swing structure — Look at the sequence of highs and lows. Consistently higher highs and higher lows signal an uptrend; the reverse signals a downtrend. This is the most fundamental and reliable method of reading direction.
2. Moving averages — A rising 50-day or 200-day moving average generally confirms an uptrend, while a falling one confirms a downtrend. Price holding above a key moving average often reinforces bullish direction, and vice versa.
3. Trendlines — Drawing a line connecting swing lows (in an uptrend) or swing highs (in a downtrend) gives a visual, dynamic gauge of direction. A break of the trendline often signals a potential shift, though it should be confirmed with other tools before acting on it.
4. Higher timeframe context — A stock might look bullish on a 15-minute chart but sit in a clear downtrend on the daily or weekly chart. Always check a higher timeframe before trusting a lower timeframe's direction — this is one of the most common mistakes new traders make.
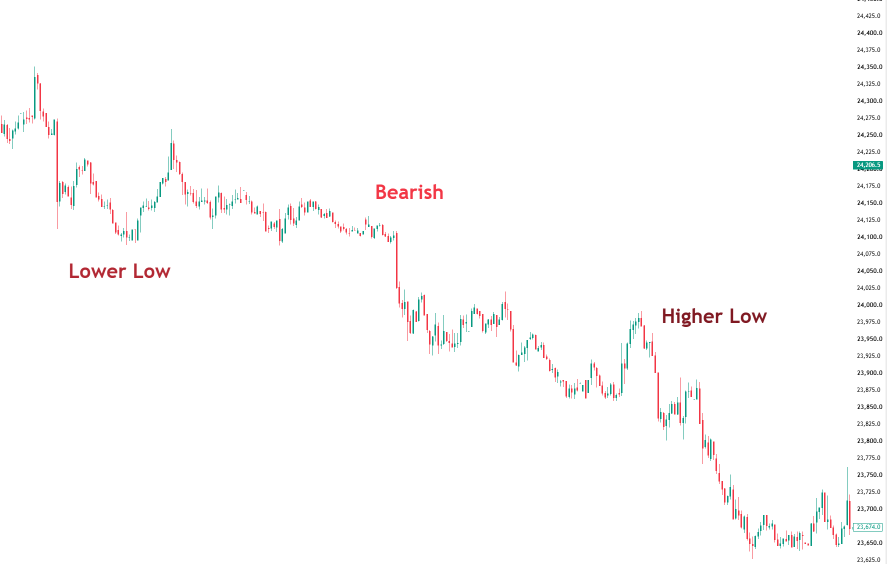
Example of bearish direction: a lower low confirms the downtrend, while a temporary higher low shows a corrective pause before the trend resumes.
Direction tells you where price is going. Momentum tells you how strongly it's getting there. A market can be in an uptrend (direction: up) while momentum is fading — often an early warning that the trend may be losing steam or due for a pullback. Combining direction with momentum tools like RSI or MACD gives a fuller, more reliable picture than looking at direction alone.
Trend-following traders trade with the established direction — buying uptrends and selling downtrends. This approach tends to have a higher win rate over time because it aligns with the path of least resistance in the market.
Counter-trend (reversal) traders try to catch the exact point where direction changes. This can be highly profitable but is riskier and demands more experience, since you're betting against the current flow of the market.
For beginners, trading with the dominant direction is almost always the safer starting point. You can explore both approaches in more depth on the Trading Direction blog.
1. Ignoring the higher timeframe and trading purely off short-term noise.
2. Fighting the trend because a stock "feels" overextended, without waiting for actual confirmation of a reversal.
3. Confusing a pullback with a trend change — not every dip in an uptrend means direction has flipped.
4. Relying on a single indicator instead of confirming direction across price action, moving averages, and trendlines together.
5. Switching bias too quickly on a single red or green candle instead of waiting for structural confirmation (a real break of the prior swing high or low).
What does "direction" mean in trading?
Direction refers to the overall path a price is moving on a chart — up (bullish), down (bearish), or sideways (range-bound).
How do I know the direction of the market?
Check the sequence of highs and lows, look at whether price is above or below key moving averages, and confirm with a higher timeframe chart before making a decision.
Is it better to trade with the trend or against it?
For most traders, especially beginners, trading with the dominant direction offers a higher probability of success than trying to catch reversals.
What is the difference between direction and trend?
They're closely related — "trend" usually refers to the sustained direction over a period of time, while "direction" can also describe shorter-term or immediate price movement within that trend.
Can direction change quickly?
Yes. Direction can shift after a break of a key trendline or swing level, but a single candle rarely confirms a change — traders typically wait for a clear break of structure before treating it as a genuine reversal.
Direction is the foundation everything else in trading is built on. Before thinking about entries, stop-losses, or position sizing, ask yourself one question: what is the market's current direction, and am I trading with it or against it? Master that question, and you'll already be ahead of most traders who jump straight into strategies without understanding the trend they're trading in.
For more guides like this on trend reading, momentum, and building a consistent trading approach, visit the Trading Direction blog and explore related posts.

Anil Hanegave
Trading Direction — helping traders understand market structure, trend, and direction with clear, practical guides.