Free Narrow CPR Stock Scanner: Daily Shortlist for Breakout Trades
Narrow CPR · Stock Scanner
There are no items in your cart
Add More
Add More
| Item Details | Price | ||
|---|---|---|---|
TRADING DIRECTION • MARKET EDUCATION
By Anil Hanegave, Trading Direction | Updated August 2026 | 13 min read
Every trader hears the word "liquidity" a hundred times before actually understanding it. It sounds technical, but it's one of the simplest — and most important — ideas in the market. Once you truly get it, you'll start reading every chart differently: you'll notice why price reverses at certain zones, why your stop loss got hunted right before the real move, and why some instruments are safe to trade with size while others eat your capital through slippage alone.
In this guide, we'll build liquidity up from a simple story, connect it to real chart structure, show you how it behaves differently across Indian stocks, commodities, forex, and crypto, explain why liquidity has been shrinking in the Indian derivatives market, and answer the most-searched liquidity questions traders type into Google.
Imagine you're on a playground with a toy truck, and you want to trade it for a toy dinosaur. If there are lots of kids around trading toys, it's easy to find someone who wants your truck — that means your toy is liquid. But if only one kid is there and they don't want trucks, it's harder to trade — that's low liquidity.
In trading, liquidity means how easy it is to buy or sell something — like a stock — without waiting long or changing the price too much. More buyers and sellers = more liquidity.
Now, think of "areas of liquidity" as the busy parts of the playground — the swings or the sandbox, where kids naturally gather to trade. In the market, these are price zones where lots of traders want to buy or sell, such as:
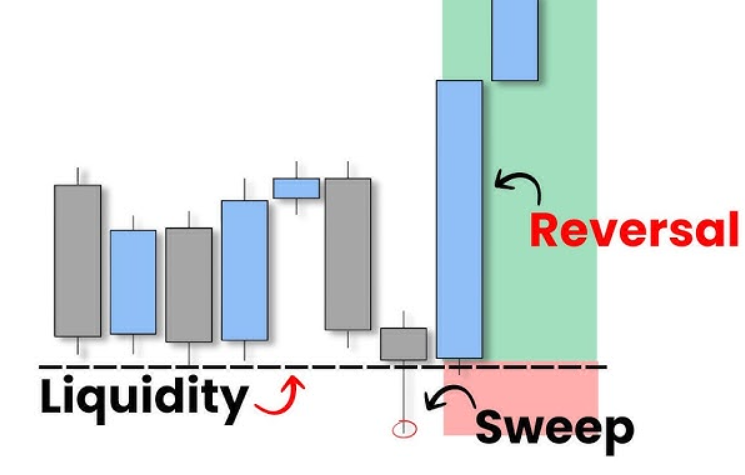
Price often "sweeps" resting liquidity below recent lows before reversing sharply — this is smart money collecting orders before the real move.
To really understand liquidity, it helps to understand its opposite — illiquidity. There are only two situations where a price doesn't change: either it's bought and sold in equal quantity, or it's neither bought nor sold at all. That second case is illiquidity.
Price moves because of demand and supply. In digital markets, price is recalculated constantly based on the volume changing hands every second — so almost any quantity you buy or sell nudges the price somehow.
Here's the picture: you go to buy oranges, but no seller is around. Then one seller shows up and agrees to sell — but you want 10 kg, and you're the only buyer facing a seller with limited stock. Because there's no one else to balance your demand, the price moves with every bit you buy:
By the time your 10 kg order finishes executing, you've paid far more per kilogram than the price you first saw — purely because there wasn't enough liquidity to absorb your order. If the market had been liquid, other sellers would have been active alongside you, keeping the price change minimal throughout your transaction.
This exact thing happens in trading every day — especially in illiquid stocks, far OTM options, and low-volume cryptocurrencies. A big order without enough participants on the other side doesn't just "execute" — it moves the market against itself.
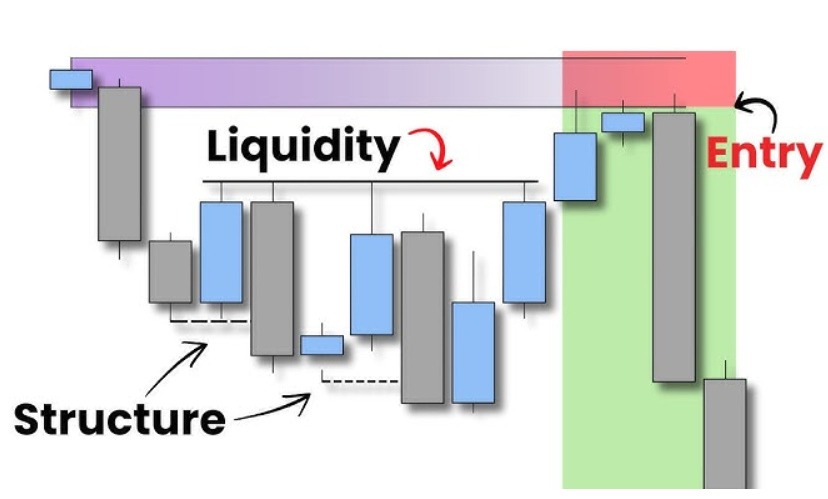
Market structure + liquidity together: price builds a structure, sweeps the resting liquidity below it, then reverses into the real entry zone.
| Type | What It Means |
|---|---|
| Buy-side liquidity | Resting buy orders / stop losses of short sellers sitting above recent highs |
| Sell-side liquidity | Resting sell orders / stop losses of long buyers sitting below recent lows |
| Market liquidity | Overall depth of an entire market or exchange (e.g., NSE cash market) |
| Instrument liquidity | Liquidity of one specific stock, option strike, or currency pair |
| Draw on liquidity | The nearest pool of resting orders that price is naturally "drawn" toward before reversing |
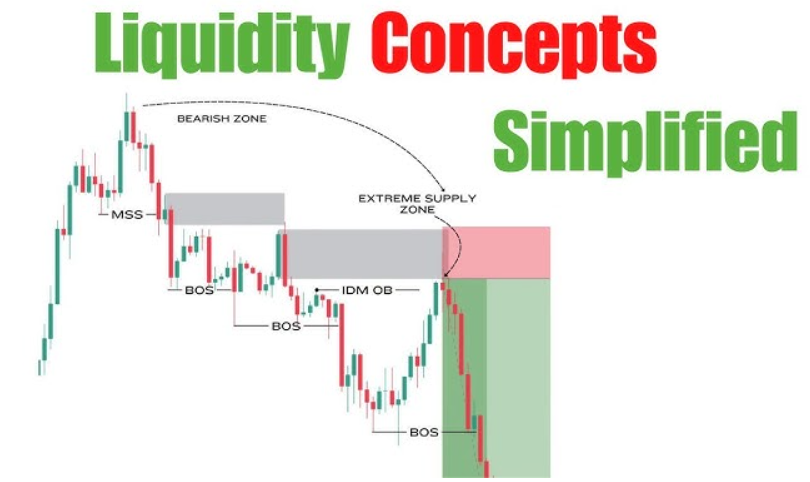
Liquidity concepts combine with market structure shifts (MSS) and breaks of structure (BOS) to map extreme supply/demand zones.
If you've traded Nifty or Bank Nifty options over the last year, you've probably noticed wider spreads, sharper gap-ups/gap-downs, and stop losses slipping more than before. This isn't random — India's F&O liquidity has genuinely fallen since late 2024, largely due to a series of SEBI measures aimed at protecting retail traders from excessive speculation:
The result: SEBI data shows unique retail traders in the equity index derivatives segment fell roughly 20% year-on-year between December 2024 and May 2025. Globally, exchange-traded options volume fell over 57% in 2025 — a decline heavily concentrated in Indian index options, which had briefly made Nifty the single most-traded index options contract in the world. Fewer participants means thinner order books — and thinner order books mean bigger, sharper gaps when news hits.
Liquidity behaves differently across asset classes. Here's how it actually plays out with real, well-known instruments:
Reliance Industries, HDFC Bank, Nifty 50 constituents — these trade in huge daily volumes with narrow bid-ask spreads, so large orders barely move the price. Compare that to a small-cap or micro-cap stock with low daily volume: even a modest order can swing the price 2-5% instantly. This is why we always tell students at Trading Direction — trade liquid stocks and current-week, near-the-money option strikes where real participation exists.
Gold (MCX Gold futures / international Gold spot) is one of the most liquid commodities in the world, with central banks, institutions, jewellers, and retail traders all participating. Liquidity is deepest during the London-New York trading overlap; it thins out during Asian session hours, which is exactly when gold prices can gap or spike sharply on light volume.
EUR/USD is the most liquid instrument on Earth, trading trillions of dollars daily — spreads are often near-zero. USD/INR, while liquid during Indian market hours, thins out significantly overnight, which is why it can gap at the open around RBI policy days or major global data releases.
Bitcoin on major exchanges (Binance, Coinbase) is highly liquid, but liquidity drops sharply on smaller exchanges or with low-cap altcoins. This is why altcoins are famous for sudden 20-30% wicks — a handful of large orders in a thin order book can send the price flying in seconds, in either direction.
For a visual, chart-by-chart walkthrough of liquidity sweeps and trap zones on Nifty and Bank Nifty, watch this video from the Trading Direction YouTube channel:
What is liquidity in trading?
Liquidity is how easily you can buy or sell an asset without waiting long or moving its price much. High liquidity means many active buyers and sellers; low liquidity means few, so trades take longer and cost more through slippage.
What is liquidity in trading with an example?
Reliance Industries shares are highly liquid — you can buy or sell thousands of shares with almost no price impact. A thinly-traded small-cap stock is illiquid — buying even a small quantity can move its price several percent.
How do you identify or spot liquidity on a chart?
Look for equal highs/lows, previous swing points, round numbers, and areas where price consolidated for a while — these are where stop losses and pending orders cluster, forming visible liquidity pools.
What are the types of liquidity in trading?
The main types are buy-side liquidity (above recent highs), sell-side liquidity (below recent lows), overall market liquidity, and instrument-specific liquidity for an individual stock, strike, or currency pair.
What is "draw on liquidity"?
It refers to the nearest significant pool of resting orders that price is likely to move toward before reversing — essentially, the market's next probable target based on where liquidity is resting.
Liquidity kya hota hai trading mein? (Liquidity in Hindi)
Liquidity ka matlab hai ki koi stock, option ya currency kitni aasani se bina price ko zyada hilaye khareeda ya becha ja sakta hai. Jitne zyada buyers aur sellers active honge, utni zyada liquidity hogi — matlab aapka order jaldi aur fair price par fill hoga.
What is liquidity in forex trading?
In forex, liquidity refers to how easily a currency pair can be traded. Major pairs like EUR/USD and USD/JPY are extremely liquid with near-zero spreads, while exotic pairs and USD/INR overnight can be far less liquid, leading to wider spreads and gaps.
Why is liquidity reducing in the Indian stock market?
Since late 2024, SEBI's index derivatives rules — upfront premium collection, higher contract sizes, single weekly expiries, and stricter margin/position limit norms — have reduced the number of active retail F&O traders by roughly 20% year-on-year, thinning out order books, especially in Nifty and Bank Nifty options.
Learn how smart money uses liquidity to trap retail traders — and how to trade on the right side of it — through our CPR Brahmastra Strategy and Intraday Trading Mastery programs.
Disclaimer: This content is for educational purposes only and does not constitute investment or trading advice. Trading in equity, derivatives, commodities, forex, and cryptocurrency carries substantial risk, including the risk of loss beyond your invested capital, and is not suitable for all investors. Trading Direction is an educational academy and is not a SEBI-registered investment advisor. Please consult a registered financial advisor before making trading decisions.