Narrow CPR Scanner Free Tool — Daily & Weekly NSE Bhavcopy Scanner
Narrow CPR · Stock Scanner
Read article →
There are no items in your cart
Add More
Add More
| Item Details | Price | ||
|---|---|---|---|
Most option traders stare at one chart and wonder why entries feel late. Here is how I line up the future, the spot index, the call and the put on one screen, and what each chart is actually good for.
Quick answerUse the spot index chart for clean levels such as CPR, PDH and PDL, the futures chart for volume and the direction of real money, and the option premium chart for your exact entry, stop loss and target. Take a trade only when at least three of the four charts (future, spot, call, put) tell the same story.
Definition: Multi-chart confluence means reading the Nifty future, the Nifty spot index, and the call and put option premiums side by side, and acting only when their levels, momentum and volume agree.
The Nifty spot vs futures chart question comes up in almost every batch I teach. A trader buys a call because spot broke a level, but the premium barely moves. Another waits for the future to confirm and enters five minutes late. Both are reading real information; they are just reading it from the wrong chart for the job. I like to trade options in Nifty 50, and the habit that improved my process most was never judging a trade from a single screen.
This guide shows the four charts I keep open together, what each one is best at, and a simple checklist for deciding when they agree. It builds on my earlier article on Premium CPR on call and put charts, so if you want the level maths on the premium itself, read that first. Here the focus is different: how the future, spot and option charts work together.
The spot chart shows the clean, calculated index price, so its levels are the most respected. The futures chart shows what traders are actually paying for Nifty, along with real volume and open interest. The option chart shows what you actually hold.
Spot (Nifty 50 index). It is a calculated number, so it has no traded volume of its own. Its strength is cleanliness: previous day high, previous day low and CPR levels are drawn on the same number that most traders and screens watch.
Futures. A future is a tradable contract, so it carries volume and open interest. It usually trades at a premium to spot because of cost of carry, and that gap shrinks as expiry approaches. In my screenshot below, the future is the GIFT Nifty contract on NSE IX, which trades for extended hours, so always check which contract your chart is showing. Many Indian-session traders prefer the NSE Nifty future for the same job.
Option premium. A call or put premium blends direction, speed, volatility and time decay. Two strikes can behave very differently around the same index level, which is why the premium chart is where I decide the actual entry and risk.
| Chart | Best used for | Weakness |
|---|---|---|
| Spot index | Clean CPR, PDH, PDL and support/resistance | No traded volume; you cannot trade it directly |
| Futures | Volume, momentum and the real direction of money | Carries a premium to spot, so levels sit higher or lower than spot levels |
| Call or put premium | Exact entry, stop loss, target and risk in rupees | Distorted by time decay and volatility; thin or gappy on far strikes |
Keep the future, the spot index, one call and one put side by side on the same timeframe family (for example 5-minute and 15-minute), with the same CPR and RSI/volume indicators on each. Consistency is what lets your eyes compare them in seconds.
Below is the exact screen I use for teaching. Left to right: Nifty future, Nifty spot, a Nifty call and a Nifty put, each with CPR levels, trap zones, an EMA and an RSI with volume panel.
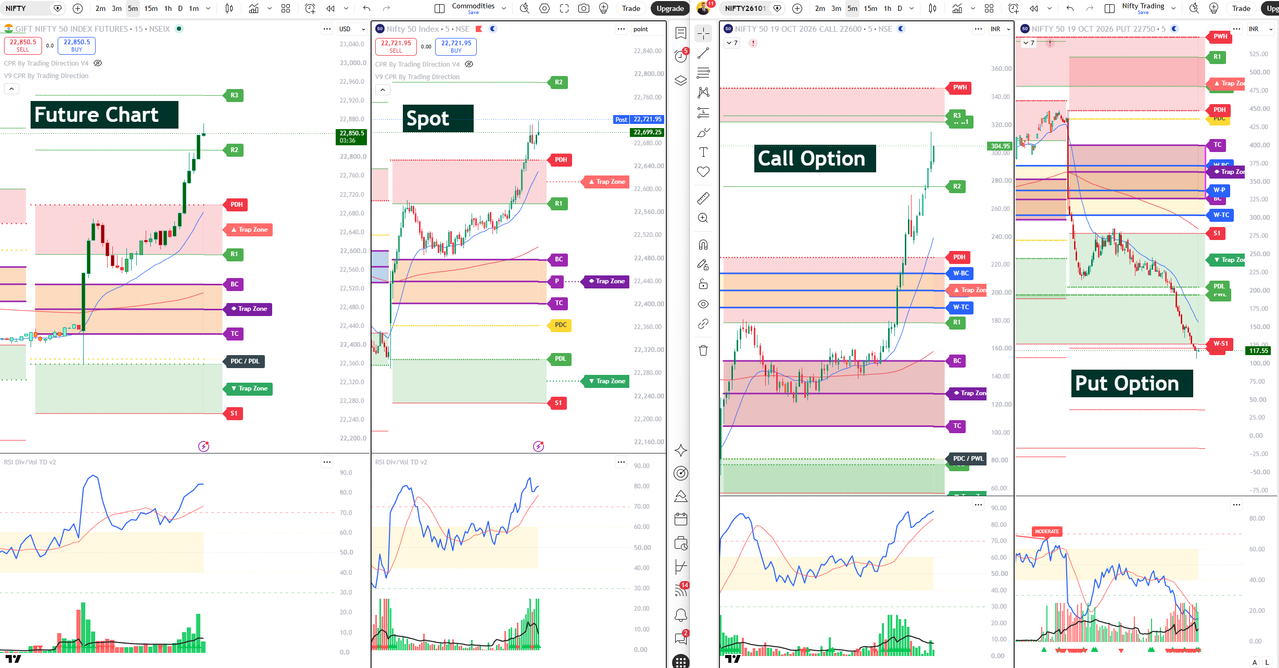
In this screenshot, every chart pointed the same way: the future and spot broke above their previous day highs, the call premium nearly doubled while the put premium collapsed. That agreement is what a high-quality confluence day looks like.
All values below are approximate, read from the screenshot, and are shown for chart-reading education only, not as a trade I took.
Decide the trade from the spot and futures charts, but place the actual entry, stop and target on the option premium chart, because that is the price you pay and the price your risk is measured in.
| Job | Chart to use | Why |
|---|---|---|
| Market bias for the day | Futures (15-minute) | Real volume and open interest show whether the move has participation |
| Key levels (CPR, PDH, PDL, R1, S1) | Spot (5-minute) | The cleanest and most widely watched numbers |
| Entry trigger | Option premium (5-minute) | Break and hold above the premium's own TC or R1 confirms buyers are paying up |
| Stop loss | Option premium | Place it below the premium's own BC or the retest low; your rupee risk is defined here |
| Target | Premium levels, cross-checked with spot R1/R2 | Premium R1, R2 or PDH is a realistic exit; spot R2 confirms the index is not stalling |
| Invalidation | Spot and futures | If both fall back inside CPR, the idea is wrong even if the premium has not hit your stop yet |
Buy a call only when the future and spot are above their CPR and previous day high, the call premium is above its own CPR with rising volume, and the put premium is falling. Reverse the logic for a put.
If four of five line up, I treat it as tradable. If three line up, I cut size or wait for a retest. Fewer than three means no trade. For strike selection once you have the direction, my guide on ATM vs ITM vs OTM strikes for Nifty covers delta and risk. Calculate your daily levels with the free CPR calculator.
Risk per trade equals capital times risk percentage. Quantity equals that risk amount divided by (entry premium minus stop-loss premium) times lot size, rounded down to whole lots.
The Nifty lot size is currently 65 units, as per NSE contract specifications. Always verify the latest lot size on the NSE website before trading. The numbers below are illustrative.
| Item | Illustrative value |
|---|---|
| Trading capital | ₹3,00,000 |
| Risk per trade (1%) | ₹3,000 |
| Call premium entry (above R1 retest) | ₹185 |
| Stop loss (below retest low / premium BC) | ₹155 |
| Risk per unit | ₹30 |
| Risk per lot (30 × 65) | ₹1,950 |
| Lots allowed (₹3,000 ÷ ₹1,950) | 1 lot (1.53 rounded down) |
| Target (premium R2) | ₹285 |
| Reward per lot (100 × 65) | ₹6,500 |
| Risk-reward | about 1 : 3.3 |
Note that two lots would risk ₹3,900, which is above the ₹3,000 budget, so the correct size is one lot. This is where the premium chart earns its place: the stop distance is read in rupees of premium, not index points.
Invalidation: if spot and the future both fall back inside their CPR, exit even if the premium stop has not been hit.
Skip the trade when the future and spot disagree, when both option premiums are rising together, or when price is stuck inside CPR or a trap zone. Disagreement means the market has not chosen a side.
| Mistake | Practical fix |
|---|---|
| Using spot CPR levels on the future chart | Each contract has its own CPR. Use the levels plotted on that chart. |
| Treating the future-spot gap as a signal | The gap is mostly cost of carry and timing. Compare structure, not the number. |
| Buying after a 2x premium move | Wait for a retest of the premium's R1 or PDH, or skip. |
| Placing the stop on spot only | Define the stop on the premium so your rupee risk is exact. |
| Different timeframes with no logic | Use 15-minute for bias and 5-minute for trigger, consistently. |
| Ignoring the opposite option | Check the put when buying a call. If both rise, stay out. |
Use spot for clean levels and futures for volume and momentum. Place the actual entry and stop on the option premium chart you are trading.
A future usually trades at a premium to spot because of cost of carry, and the gap narrows towards expiry. The exact gap changes through the day.
No. The index is a calculated number with no traded volume. Use the futures chart for volume and open interest.
Many traders use 15-minute for bias and 5-minute for entries. Keep the combination the same every day so your eyes learn the pattern.
The Nifty lot size is 65 units from January 2026 expiries, based on the NSE circular. Verify the latest value on the NSE website before trading.
Yes, because the rules are simple. Paper trade first, keep size small and never risk more than a fixed percentage of capital on one trade.
Spot gives you the map, the future tells you whether money is moving, and the option premium decides your entry and risk. Open all four charts, check the five points, size by rupee risk, and walk away when they disagree. Run this checklist on paper for two weeks before using real money.
Want to learn the CPR levels used in these charts step by step?
Join the CPR Brahmastra webinar