Free Narrow CPR Stock Scanner: Daily Shortlist for Breakout Trades
Narrow CPR · Stock Scanner
There are no items in your cart
Add More
Add More
| Item Details | Price | ||
|---|---|---|---|
By Anil Hanegave, Trading Direction · 7th August 2025 · 6 min read
Part of the Intraday Options Trading: The Complete Guide series.
Buy-and-hold is a genuinely sound approach for long-term mutual fund investing — given enough years, compounding and time in the market absorb drawdowns that would be fatal on a shorter horizon. That's a real edge, but it's a different edge, and it depends on a variable intraday traders don't have: time.
An intraday position doesn't get years to be right. It gets hours, and the capital deployed into it has to be available to trade again the next session. There's no time value of money working in your favour the way it does for a long-term holding — a stuck or oversized intraday loss doesn't "average out" later, it just sits there as capital you can no longer use. That's the real job of a stop loss in this style of trading: not predicting the market correctly, but protecting the capital that lets you take tomorrow's setup.
Every intraday trade at Trading Direction is protected by three layers of stop loss, stacked in this order:
| Layer | Rule | Purpose |
|---|---|---|
| 1. Money Management | Risk 2–3% of trading capital per trade — a hard ceiling, regardless of what the technical stop implies. | Caps the maximum damage of any single trade before the chart is even considered. |
| 2. Technical (Trap Zone) | Stop placed beyond the nearest trap zone — a CPR/pivot band where price commonly fakes a break before reversing — not a fixed point-distance from entry. | Avoids being stopped out by normal noise inside a zone that regularly produces false breakouts. |
| 3. Trailing (20 EMA) | Once the trade is in profit, trail the stop using the 20 EMA on the execution timeframe. Exit on a close back through it. | Locks in profit progressively instead of relying on a single fixed target. |
The money management layer always wins if there's a conflict: if the technical stop (layer 2) implies more than 2–3% risk at your current position size, you reduce the quantity — you never accept the extra risk just because "that's where the trap zone is."
| Trade Type | Chart Used for the Stop | Why |
|---|---|---|
| Option buying | Index or futures chart (the underlying) | CPR, trap zones, and the 20 EMA are read off the underlying's price action, then translated into a premium-based order — the underlying is what confirms or invalidates the setup. |
| Option selling | Options premium chart itself | Premium behaviour and theta decay drive the risk on a sold option, so the stop is set directly where the premium chart shows invalidation. |
There will be a small variance between the two approaches on any individual trade — the index can be calm while a premium spikes on IV alone, or vice versa. That's expected. Over a large enough sample of trades, applying each rule consistently to the instrument it's meant for is what makes the framework hold up, not getting every single trade to line up perfectly between the two charts.
A valid technical stop loss doesn't automatically make a trade valid. Before entry, the distance to the stop is compared against the distance to a realistic target. If the resulting reward-to-risk doesn't clear a minimum bar — even when the CPR setup and trap-zone logic are textbook — the trade is skipped, not resized into a worse risk.
This is the piece traders most often skip: a "good chart" with a poor reward-to-risk is still a bad trade. The stop loss level is only applicable — worth risking capital on — when what you stand to gain justifies what you're putting at risk.
Live example — NIFTY 50, 5-minute chart, 2 May 2026.
The first zone on this chart was marked No Entry — price was consolidating inside a trap zone that hadn't produced a clean technical trigger, so no trade was taken there despite the temptation of the range.
The actual Entry came after price broke and held above that zone, confirmed against the CPR levels plotted by the CPR V6.2 + Future CPR indicator. Price pulled back afterward toward the technical stop loss zone but never closed through it — the trade description on the chart is exactly that: Stop Loss not Hit.
The position was carried through the pullback, and the next session opened with a gap up, extending the move significantly beyond where the trade was entered. This is the trailing layer of the framework working as intended: the stop wasn't moved closer out of impatience during the pullback, which is exactly what let the trade stay in the position for the continuation.
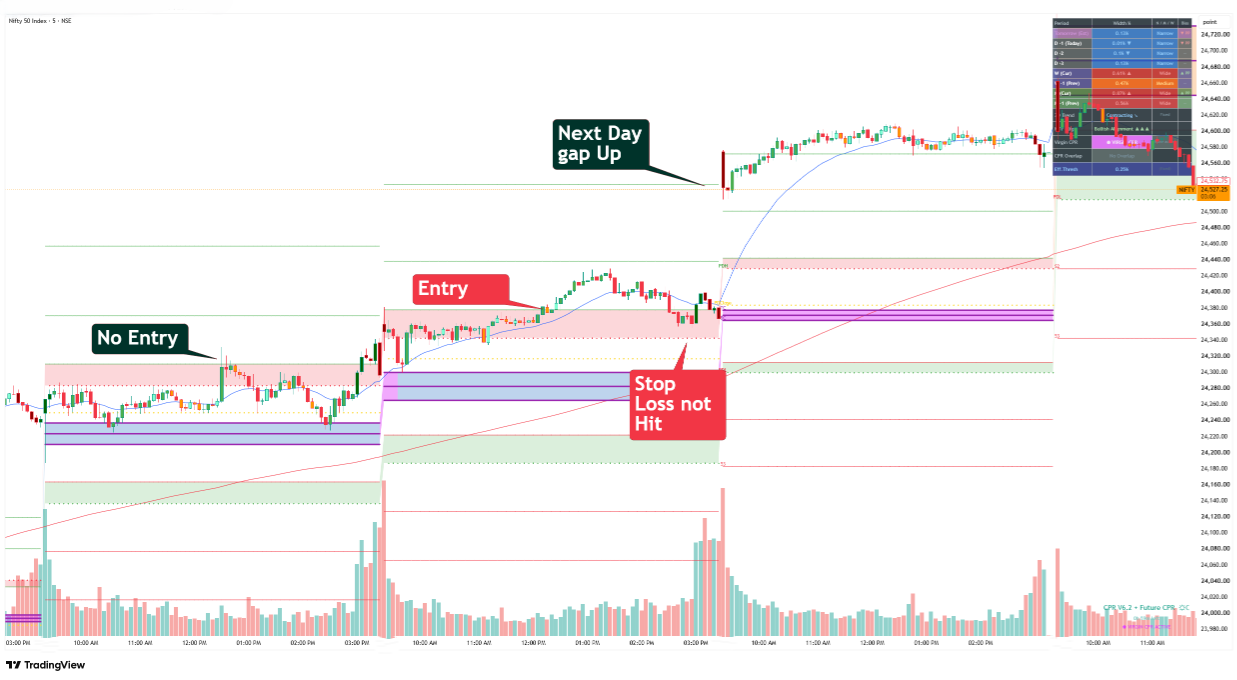
No Entry avoided inside the trap zone → confirmed Entry → pullback holds above the technical stop → next-day gap up extends the move.
Live example — NIFTY 50, 5-minute chart, {{FILL_DATE_RANGE}}
This is the more instructive case, because it's not a clean winner from the first candle. An Entry was taken inside a defined zone; price failed to hold and the Stop Loss was hit — a small, planned loss, capped by the money-management and technical layers, not an open-ended one.
On renewed confirmation the next session, a fresh Entry was taken. This time price trended cleanly, and the position was trailed using the 20 EMA rule until it reached Take Profit at the next resistance zone.
Looked at as a pair, this is what "the stop loss rules stop losses" actually means in practice: the first trade lost, but the loss was small and defined by design, so it didn't stop the second, larger, winning trade from being taken with full capital and full discipline the very next session.
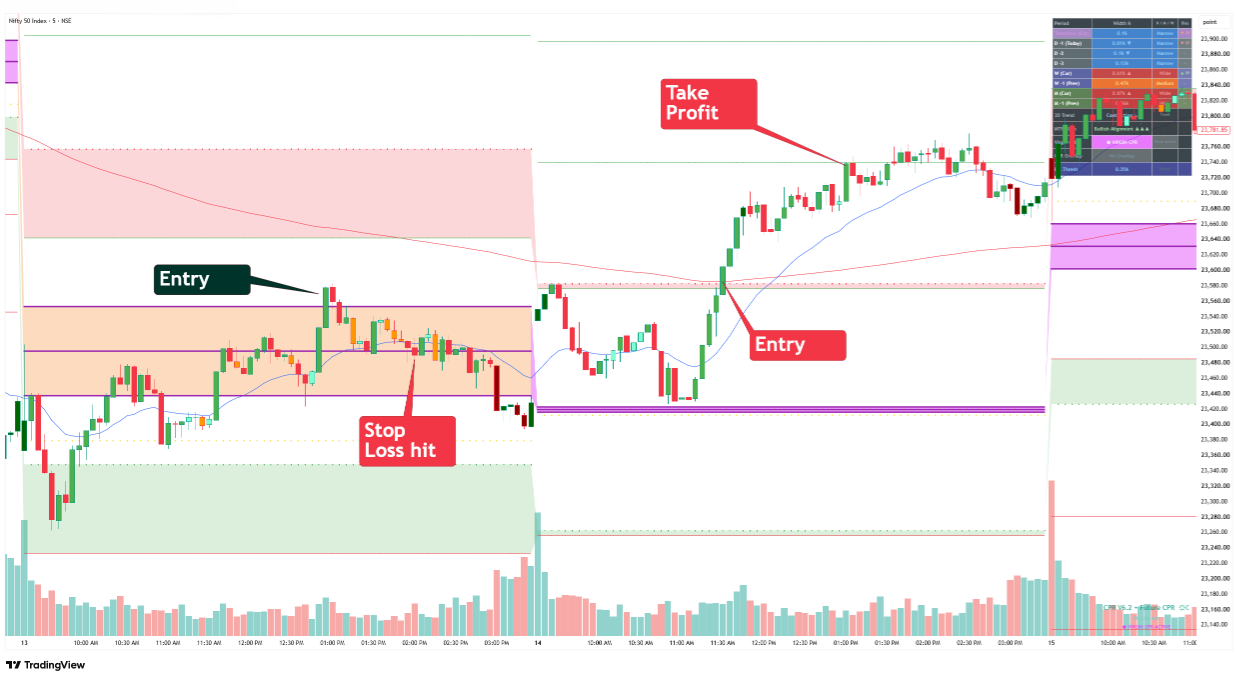
Entry → Stop Loss hit (controlled loss) → fresh Entry → Take Profit. The capped loss on trade one is what made trade two possible.
Not on any individual trade — that's the part beginners misunderstand. A stop loss doesn't prevent a trade from losing. What it does is refuse to let one loss become disproportionate to your capital or to the edge your framework has over time.
Both case studies above make this concrete. In Case 1, the stop simply wasn't needed — but it was there the whole time, sized correctly, ready to cap the loss if the pullback had continued instead of reversing. In Case 2, it was needed, it did its job at a small, planned size, and that's exactly what preserved the capital and the composure to take the winning trade that followed. The rules "stop losses" at the level of the whole sequence of trades, not any single candle.
| Mistake | Correct Approach |
|---|---|
| Sizing the position first, then finding out the technical stop implies more than 2–3% risk | Set the technical stop from the trap zone first, then size the quantity backward to fit the 2–3% money-management cap |
| Widening the stop when the trade "just needs a bit more room" | The stop was placed beyond the trap zone for a reason — if it's hit, the zone failed, not just "needed room" |
| Taking a technically clean setup with a poor reward-to-risk | Skip trades where the target doesn't justify the stop distance, regardless of how good the chart looks |
| Using the index chart's stop level for an option-selling trade, or vice versa | Match the chart to the trade type — index/futures for option buying, options premium chart for option selling |
| Re-entering the same failed zone repeatedly after a stop out | One re-entry maximum per setup, per session, and only on renewed confirmation |
2–3% of trading capital per trade is the money management ceiling. If the technical stop implies more risk than that at your current size, the position is reduced — the stop is never widened to fit a bigger size.
A trap zone is a CPR or pivot-based price band where price commonly fakes a breakout before reversing. The technical stop is placed beyond this zone, not just a few points from the entry candle, so normal noise doesn't trigger an early exit.
Once a trade is in profit, the stop is trailed using the 20 EMA on the execution timeframe, and the position exits on a close back through it — rather than being held for a single fixed target only.
For option buying, levels are read off the index or futures chart and translated into a premium order. For option selling, the stop is set directly on the options premium chart, since premium behaviour and theta drive that risk.
Not on any single trade — a stop loss rule caps how large one loss can be. It stops losses at the level of a sequence of trades, by keeping every loss small enough that winning trades taken at a favourable reward-to-risk ratio outweigh them over time.
No. Buy-and-hold works for long-term mutual fund investing where time and compounding absorb drawdowns. Intraday trading uses capital that has to survive to trade again the next session, so capital protection through a stop loss isn't optional the way it can be for a long-term investor.

Anil Hanegave, Amazon Bestselling Author
Founder, Trading Direction — CPR, Price Action & Heikin Ashi trading education for 21,000+ students across India.
← Back to the full Intraday Options Trading Guide
Disclaimer: This page is for educational purposes only and does not constitute investment advice. Trading involves risk — please consult a SEBI-registered advisor before trading. The case studies above reflect real, dated trades shared for educational illustration and are not representative of typical or future results.