Narrow CPR Scanner Free Tool — Daily & Weekly NSE Bhavcopy Scanner
Narrow CPR · Stock Scanner
Read article →
There are no items in your cart
Add More
Add More
| Item Details | Price | ||
|---|---|---|---|
The best support and resistance strategy for intraday trading is to mark PDH, PDL, CPR and weekly pivots on a 5-minute chart, treat overlapping levels as Trap Zones, and compare GIFT Nifty Futures with Nifty Spot. On the first test of a Trap Zone, do not chase the breakout. Trade only after a rejection candle or a confirmed retest, and size every position from your stop-loss.
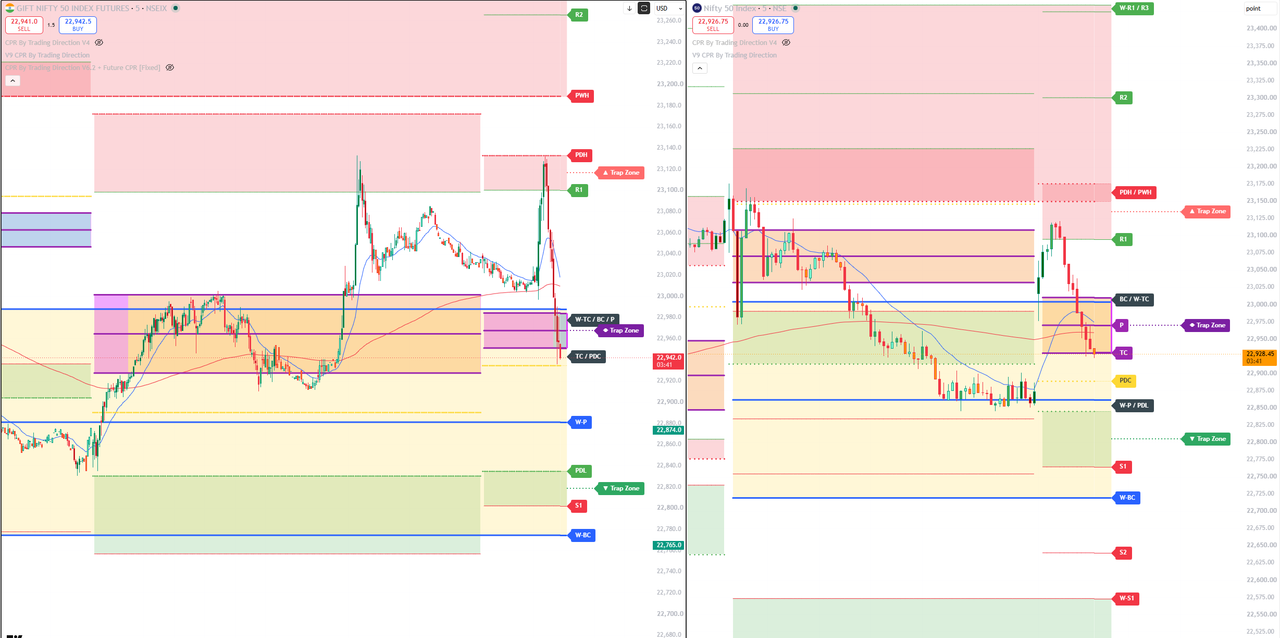
This is the setup the whole article is built on: GIFT Nifty 50 Futures (left) and Nifty 50 Spot (right) on the 5-minute timeframe, with the CPR by Trading Direction indicator. Red zones are resistance, orange and yellow bands are the CPR and pivot area, and green zones are support. The ▲ ◆ ▼ Trap Zone tags on the right edge mark where levels overlap and the first touch is most likely to be contested. On phones, swipe sideways to pan the chart.
Mastering support and resistance trading strategies for intraday trading means going beyond lines drawn on random wicks. Professionals study where orders cluster, where several levels overlap, and how a second market, such as GIFT Nifty, behaves at the same price. In 9+ years of trading and mentoring, I have watched retail traders repeat one mistake: buying straight into resistance on the first touch, then watching price collapse into a sweep. This guide gives you a rule-based alternative.
Markets move from one pool of orders to the next. Yesterday's high holds buy-stops from short sellers and breakout orders from momentum traders. Yesterday's low holds the opposite. When price returns to these prices, a burst of volume appears, and the reaction tells you who is in control. A level is not magic. It is simply a place where a lot of orders are known to sit.
For intraday traders, this has a practical meaning: the first reaction at a level is the least reliable, because both sides are still testing each other. The second reaction, after price has shown how it behaves there, is far more informative. Almost every rule in this article comes from that one idea.
Too many lines make a chart useless. Keep a short, fixed list and treat overlaps as the real signal:
When two or more of these fall within roughly 30 to 50 points of each other, you have a Trap Zone. A zone, not a single line, is the correct way to think: price rarely reverses to the exact tick.
Start with the zone above price. On the left panel, GIFT Nifty rallied into the R1 to PDH area, printed a spike near 23,130 and fell hard, a classic first-touch rejection at a ▲ Trap Zone. On the right panel, Nifty Spot bounced from the W-P / PDL area near 22,860, pushed up into R1 around 23,100, failed, and then slid back through the CPR band to about 22,930, close to TC.
Now use the CPR as the map. The BC/W-TC and pivot lines near 23,000 and 22,975 acted as resistance once price was back below them, while W-P / PDL near 22,860 stayed in view as the next demand area. Then add the second market: GIFT Nifty rejected PDH first, which was an early warning for Spot. The lesson is not to predict the exact top. It is to notice that the area had several reasons to react, that the first touch produced rejection, and that the CPR gave a clean level to trade against afterwards.
When price reaches a level like 23,120 for the first time in a session, retail traders see a green breakout candle and buy. Large passive sell orders inside the zone absorb that demand, momentum stalls, and price chops sideways or rejects. Once buyers are exhausted and their stop-losses sit just below, a sharp drop can follow. Knowing this sequence keeps you from impulse trades at major boundaries.
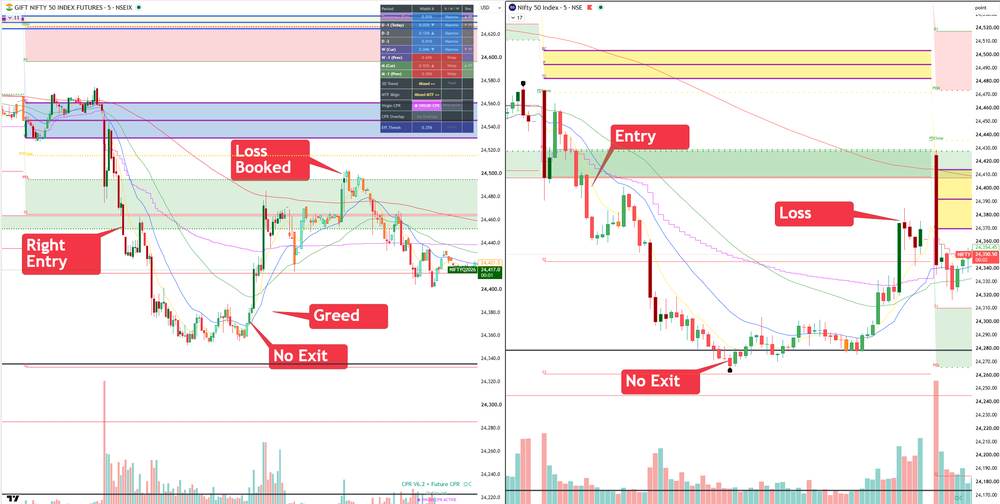
When price first enters a Trap Zone, implied volatility often rises, and price tends to range while orders fill. Sellers can use that: collect premium from options that expire worthless if price stays contained.
📚 Want the indicators and course behind this setup? Browse the Trading Direction Store or join the Pro Traders Mentorship Program.
In our example, price breaks below the CPR and daily pivot at 22,980. Instead of chasing the first red candle, follow three steps:
The same logic works in reverse for longs above a broken resistance. If the retest never comes and price simply runs, skip the trade. Missing a move costs nothing; chasing it costs money.
| Parameter | Short Strangle | Directional S&R |
|---|---|---|
| Objective | Harvest theta during range absorption | Capture the move after a level breaks |
| On 1st touch | Preferred, profits from consolidation | Cautious, needs retest or sweep |
| Directional risk | Lower, but gap and trend risk if unhedged | High, vulnerable to sweeps |
| Main drivers | Falling IV and theta decay | Volume and price action candles |
| Risk management | Stop-loss per leg, hedge wings | Stop beyond sweep high or low |
Assume capital of ₹5,00,000 and a risk limit of 1% per trade, which is ₹5,000. Using the short trade above: entry 22,985, stop-loss 23,010, so the risk is 25 points. Quantity = 5,000 ÷ 25 = 200 units, which you then round down to whole lots of the current Nifty lot size. Target 22,875 is 110 points away, a reward-to-risk of about 4.4 to 1 on paper.
Real trades rarely reach the full target, so plan on partial exits: book half near the first support and move the stop to cost on the rest. Also remember slippage, brokerage and taxes. A strategy that wins 40% of the time with a 2 to 1 reward-to-risk can still be profitable, but only if you actually follow the stop.
The 9:15 to 10:30 AM window offers the widest ranges and cleanest reactions at PDH, PDL and CPR. The 12:00 to 1:30 PM lull produces many false signals because volume thins out, so reduce size or stand aside. From 2:00 to 3:15 PM, momentum often returns as positions are squared off, which suits breakout and retest trades. Avoid opening new positions in the last few minutes unless you have a clear plan.
Mark PDH, PDL, CPR and weekly pivots on a 5-minute chart, treat overlaps as Trap Zones, and trade only after a rejection candle or confirmed retest, never on the first touch alone.
An area where several resistance or support levels overlap, such as PDH, PWH and R1. Breakout orders cluster there, so false breakouts and sweeps are common.
GIFT Nifty trades extended hours and often shows early reaction at key levels, helping confirm whether Nifty Spot is respecting or sweeping them.
Use the 5-minute chart for entries and the 15-minute chart to confirm closes beyond a level.
Many traders cap risk at 0.5% to 1% of capital per trade, then size the position from the stop-loss distance.
On the first test of a Trap Zone price often consolidates, which can favour defined-risk option selling. It still carries substantial risk and needs strict stop-losses.
Explore the Trading Direction Store or the Pro Traders Mentorship Program.
Intraday success is not about predicting every candle. Combine dual-chart analysis, respect CPR boundaries, avoid first-touch chasing, and define your risk before entry.
Rule-based learning and tools directly from Anil Hanegave.
Visit the Store Pro Traders Mentorship