Narrow CPR Scanner Free Tool — Daily & Weekly NSE Bhavcopy Scanner
Narrow CPR · Stock Scanner
Read article →
There are no items in your cart
Add More
Add More
| Item Details | Price | ||
|---|---|---|---|
How to read RSI with CPR levels, PDH and PWH, and why price, not RSI, decides your entry
An RSI bullish range means RSI keeps holding roughly between 40 and 80 during an uptrend. Pullbacks stop near 40-50 and rallies push beyond 70. That tells you buyers control the trend, so an RSI above 70 is not an automatic sell. Use it as confirmation, and let CPR levels and candle closes decide entry and stop-loss.
The RSI bullish range (तेजी range) is the band in which the 14-period Relative Strength Index tends to oscillate in a healthy uptrend, about 40 to 80, instead of the textbook 30 to 70. The idea of RSI "range shift" comes from the work of Andrew Cardwell and Constance Brown.
Most traders learn RSI as a simple rule: sell above 70, buy below 30. In a strong trend, that rule keeps you out of the best moves. The RSI bullish range gives a more useful reading: it shows which side is in control. In this article I use a real Nifty chart with CPR levels (Central Pivot Range), PDH (Previous Day High) and PWH (Previous Week High) to show how I read it, and where it stops being enough.
RSI measures the speed of recent price moves on a 0 to 100 scale. In an uptrend it tends to stay between about 40 and 80, with dips finding support near 40-50. Some sources place the upper end nearer 90, so treat these numbers as an empirical guide, not a fixed law.
J. Welles Wilder introduced RSI in 1978 and the default setting is 14 periods. Concept first, then chart logic: when buyers dominate, selling pressure is short-lived, so RSI rarely falls to 30. The mirror image holds in a downtrend, where RSI tends to stay between about 20 and 60 and rallies stall near 50-60.
The 70/30 rule treats every market the same. The range-shift view first asks which regime you are in, then reads RSI inside that regime. In an uptrend, an RSI of 40-50 is often a pullback buy zone (support), not weakness.
| RSI reading | Textbook 70/30 view | Range-shift view in an uptrend |
|---|---|---|
| Around 30 | Oversold, buy | Rarely reached. If RSI loses 40, the bull range is under threat. |
| 40 to 50 | Neutral | Pullback support zone (तेजी में dip). Check CPR support too. |
| 60 to 80 | Neutral to strong | Healthy bull range. Momentum favours buyers. |
| Above 70 | Overbought, sell | Common in strong trends. Not a sell on its own. |
| Above 80 | Extremely overbought | Stretched. Needs price confirmation at the next resistance. |
On the chart below, price climbed from the Weekly CPR support area to the R2 / W-R1 resistance while RSI moved from the 40 zone to above 80 and stayed above its own signal line. Price and RSI agreed the whole way up.
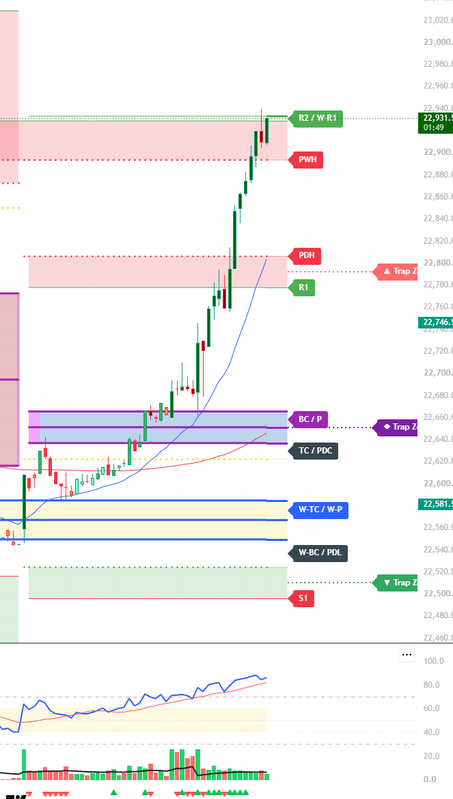
Here is the sequence, using the WDP Sequence (Weekly CPR → Daily CPR → Price match):
An RSI above 80 shows very strong momentum, but it does not tell you where the market will stop. When price reaches a stacked resistance such as PWH plus R2 / W-R1 and prints a long upper wick, the location becomes the main risk, not the RSI value.
At the right edge of the chart, price touches R2 / W-R1 inside a shaded resistance zone and the last candle shows an upper wick, which means sellers tried to push price back. Trend is bullish, but location is difficult. Three outcomes are possible:
Mark levels first, read the RSI range second, and act only after a candle close at a key level. RSI confirms the bias, while CPR levels and candle closes give the entry, stop-loss and invalidation.
Using the chart levels, here are two illustrative plans with a fixed 1% risk on a ₹5,00,000 account, which is ₹5,000 per trade. Quantity equals risk amount divided by stop-loss points. These are teaching numbers, not recommendations.
| Item | Plan A: acceptance above R2 / W-R1 | Plan B: pullback to PDH / R1 zone |
|---|---|---|
| Entry (index points) | 22,945 after close above zone and a holding retest | 22,810 near PDH with RSI holding 50+ |
| Stop-loss | 22,895 (below PWH) = 50 points | 22,770 (below R1) = 40 points |
| Target | 23,045 = 100 points | 22,890 = 80 points |
| Risk-reward | 1 : 2 | 1 : 2 |
| Quantity | ₹5,000 ÷ 50 = 100 units | ₹5,000 ÷ 40 = 125 units |
| Invalidation | Candle closes back below PWH and RSI loses 60 | Candle closes below R1 and RSI falls under 50 |
Quantity must be a multiple of the current lot size, so check the latest Nifty lot size on the NSE website. If you trade options instead of futures, draw the levels on the option chart itself; I explain that in Premium CPR: How to Use CPR on Call and Put Option Charts.
| Mistake | Practical fix |
|---|---|
| Shorting only because RSI crossed 70 or 80 | Wait for a lower high, a close below a level and RSI losing 60 or its signal line. |
| Buying into resistance because "RSI is bullish" | Check the Trap Zone first and wait for a candle close or a retest. |
| Using an RSI value as the stop-loss | Anchor stop-loss to a CPR level, PDH / PDL or a candle low. |
| Changing RSI settings after every loss | Keep one setting (14 by default) and read it consistently. |
| Ignoring the higher timeframe | Confirm the regime on the Weekly and Daily charts before using RSI intraday. |
RSI holding above 50 shows bullish bias, and holding between about 40 and 80 with higher highs marks a bull range. Dips that stop near 40-50 are a typical sign of a healthy uptrend.
Not by itself. In strong trends RSI can stay above 70 for a long time. Treat it as a warning to watch price at resistance, and act only on a rejection candle or a close below a key level.
It is a change in the band RSI respects. When RSI starts holding 40-80 instead of 20-60, the regime moves from bearish to bullish. Losing 40 in an uptrend is an early sign the regime may be turning.
The default 14 is the standard and a good starting point. What matters more is using one setting consistently and confirming it with price levels such as CPR, PDH and PWH.
Yes. CPR gives the levels and bias, RSI confirms momentum. Use CPR for entry, stop-loss and invalidation, and RSI to judge whether momentum supports the move.
Bearish divergence means price makes a higher high while RSI makes a lower high. It warns that momentum is fading. On the chart in this article, price and RSI were making higher highs together, so no divergence was visible.
In the CPR Brahmastra Strategy webinar I explain the WDP Sequence and Trap Zones, which is the base for the levels used in this article.
See the CPR Brahmastra webinar